The Return of the Ticket Buyer Study
The Performing Arts Ticket Buyer Media Usage Study is back to provide you with the data you need as an arts marketer in 2020. We created this study as a resource for arts marketers in organizations of all shapes and sizes to navigate this rapidly changing media environment and the 2019 report breaks new ground as the follow up to the study we debuted in 2017.
This year’s study is based on over 18,000 responses to an online survey from patrons of 40 performing arts organizations across the country. In its second iteration, the study harnesses year-over-year data to reveal where behaviors have changed and remained the same, adding new depth to the findings.
The challenges and opportunities that the Study Partners, our clients, and organizations across the field encounter every day have helped us make the 2019 survey even stronger than before. We’re particularly grateful for our 40 Study Partners whose input, time, and efforts were invaluable to this project.
What You’ll Find in the 2019 Report:
Here’s just a taste of the key findings, topics, and data you’ll find in the 2019 Performing Arts Ticket Buyer Media Usage Study:
Patron Loyalty
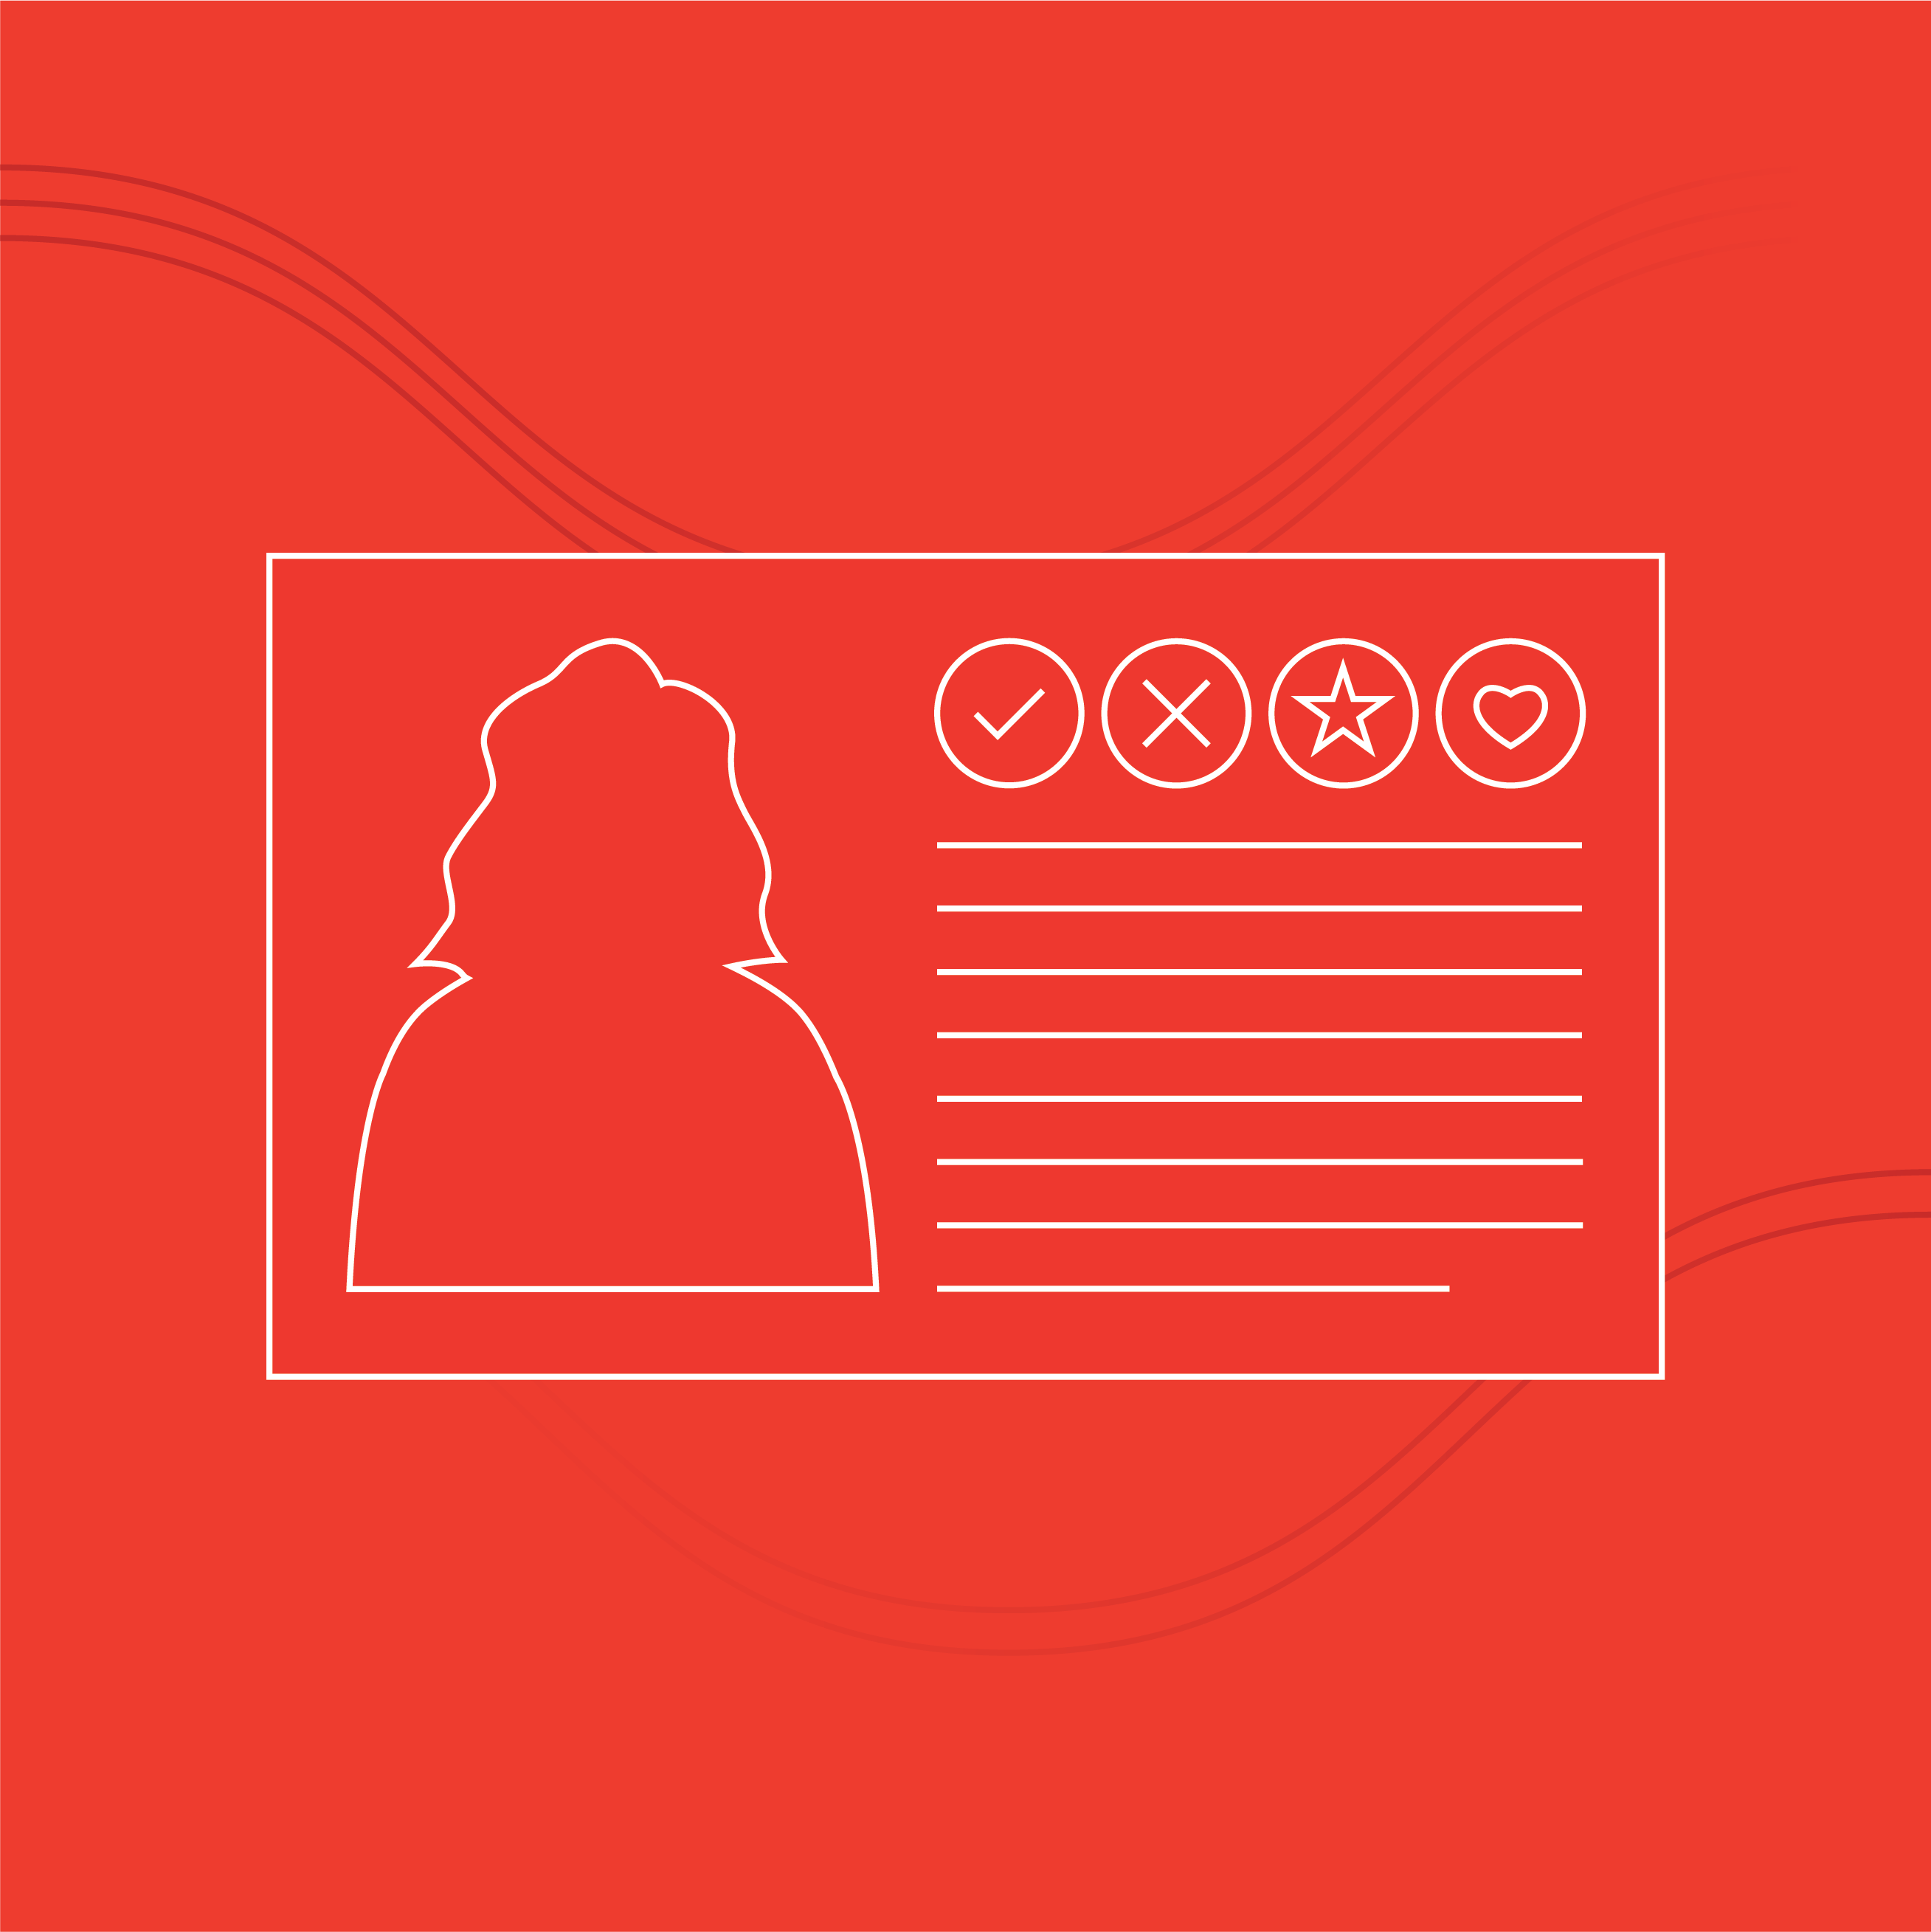
Loyalty doesn’t require a subscription. 87% of high-frequency attenders said they have a strong bond with your organization. We have lots of details on how high-frequency attenders and subscribers rated their loyalty.
SMARTPHONE & DEVICE USAGE
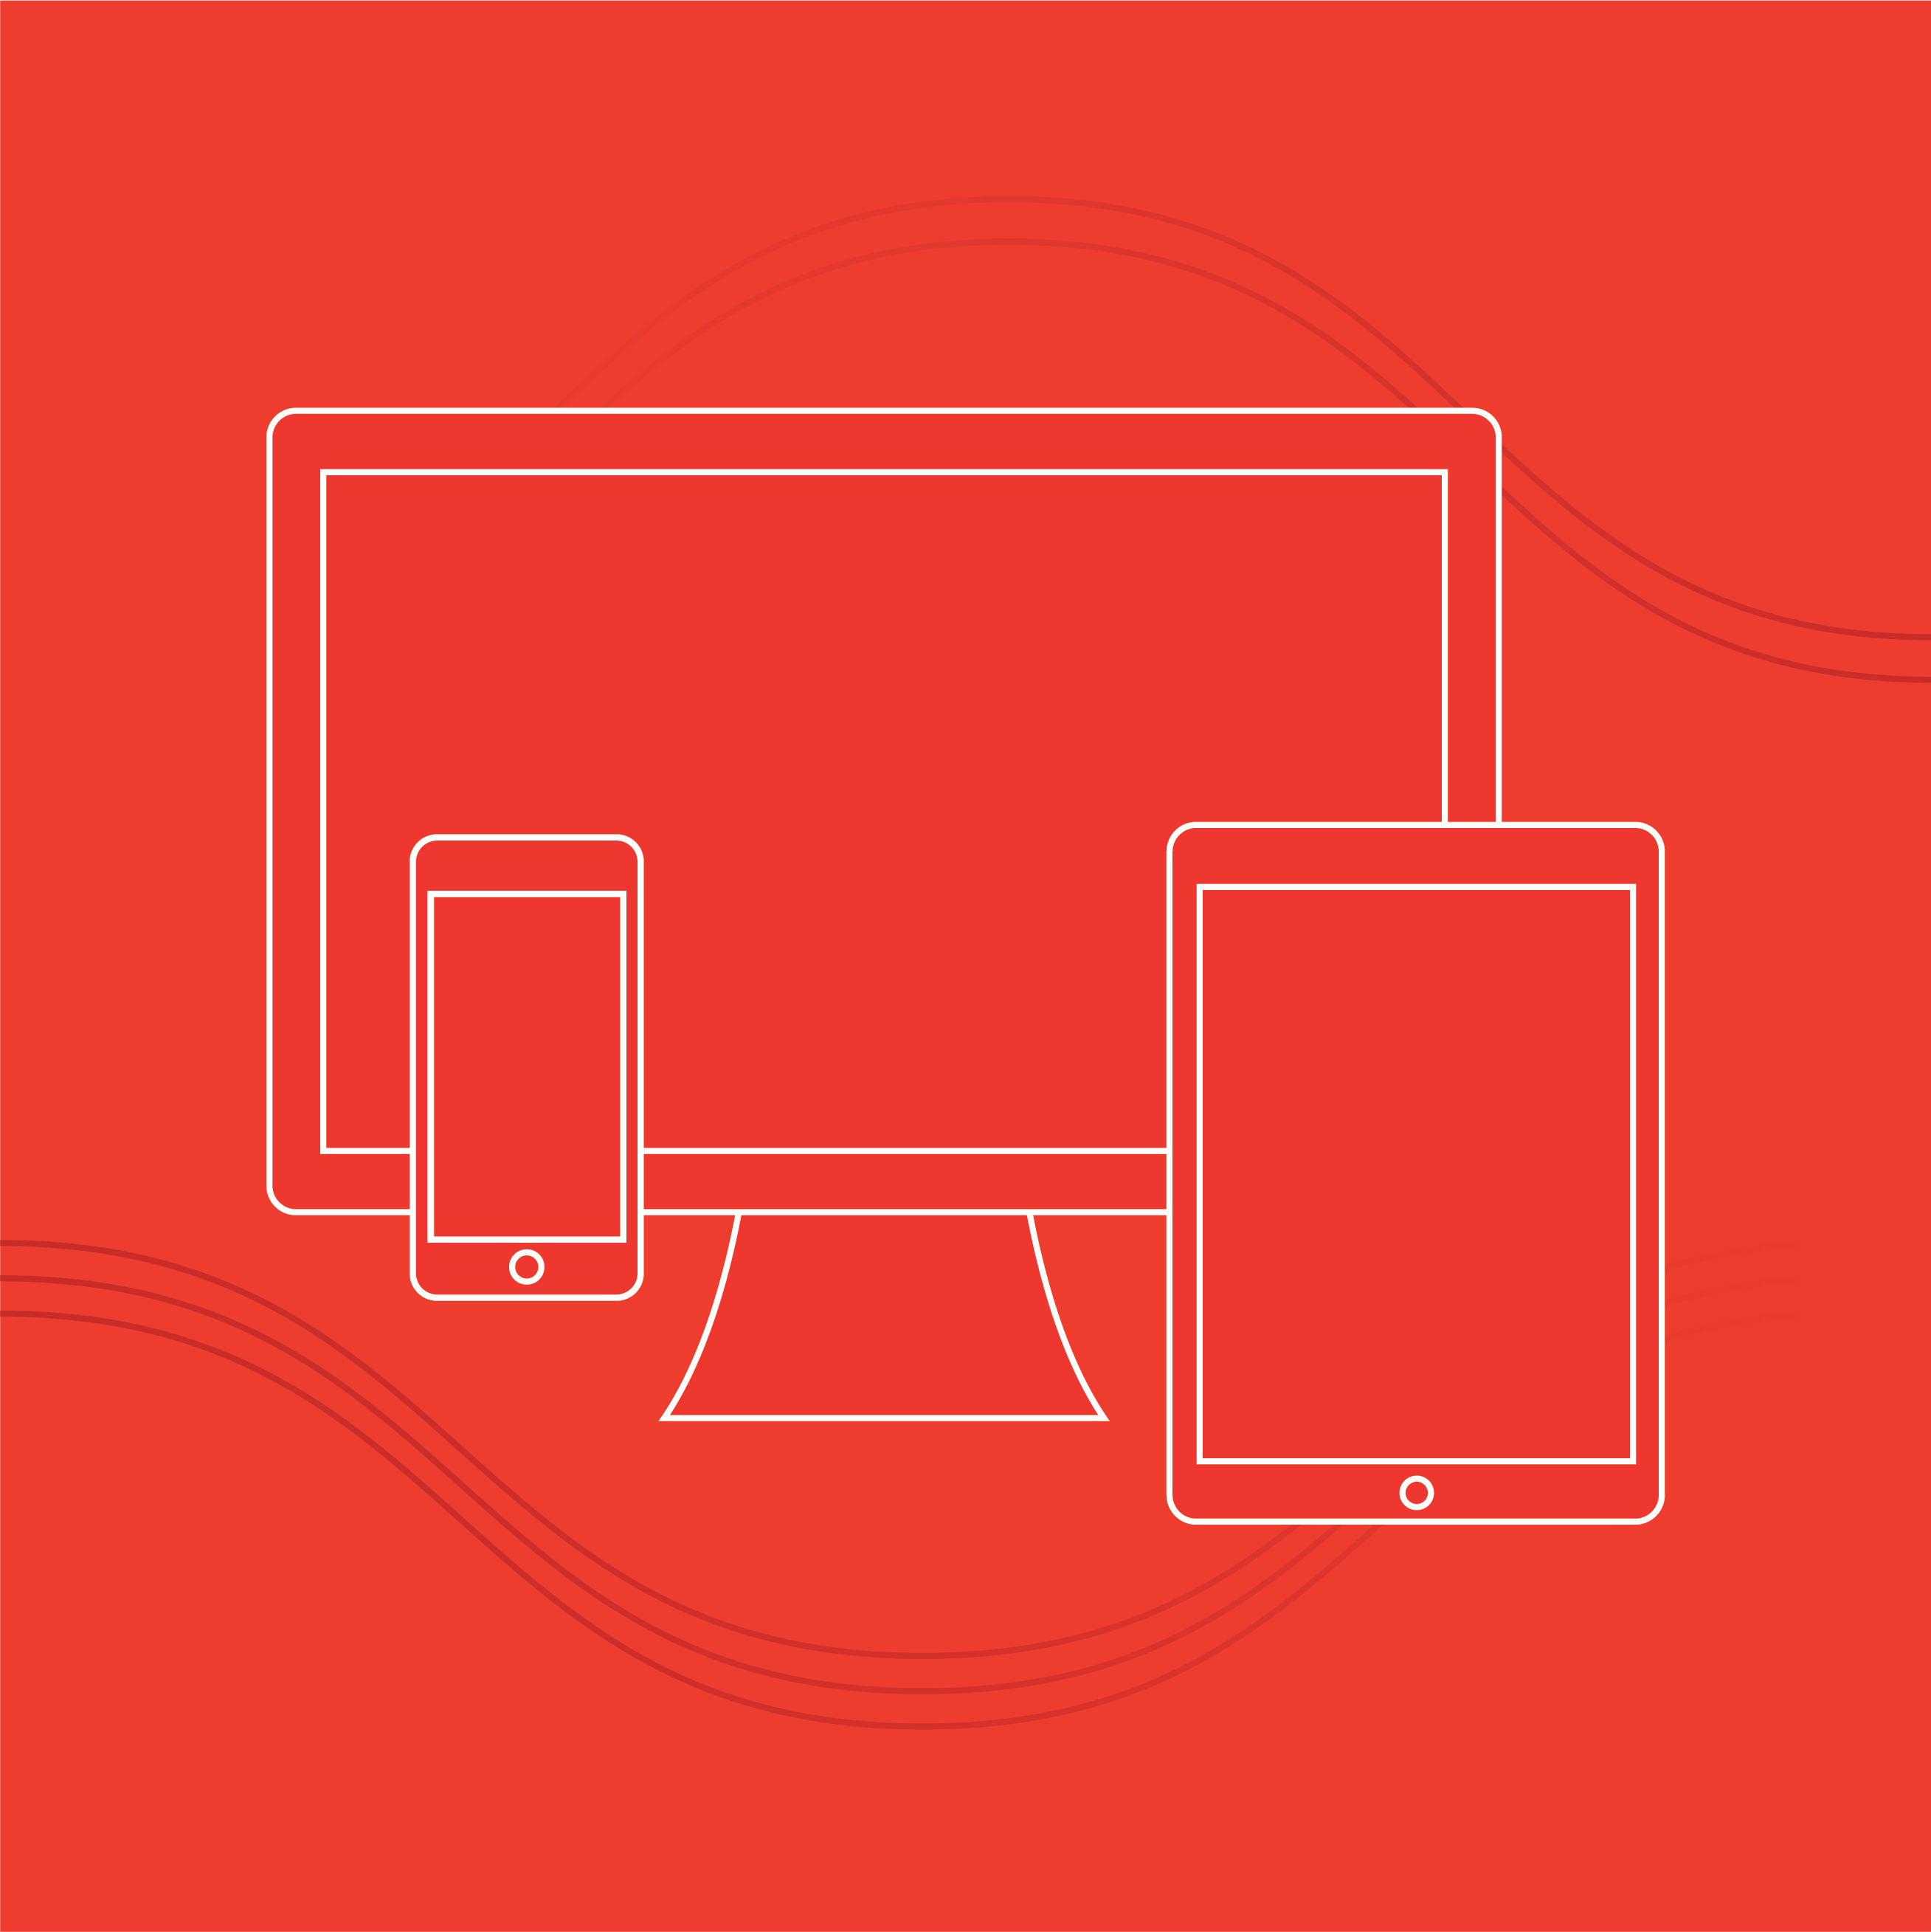
Daily smartphone use increased across the board, but growth was strongest for those over 45 where we saw a 23% increase from 2017. We checked in on the spectrum of devices for you.
EMAIL COMMUNICATIONS & SOURCES OF ARTS EVENTS INFORMATION
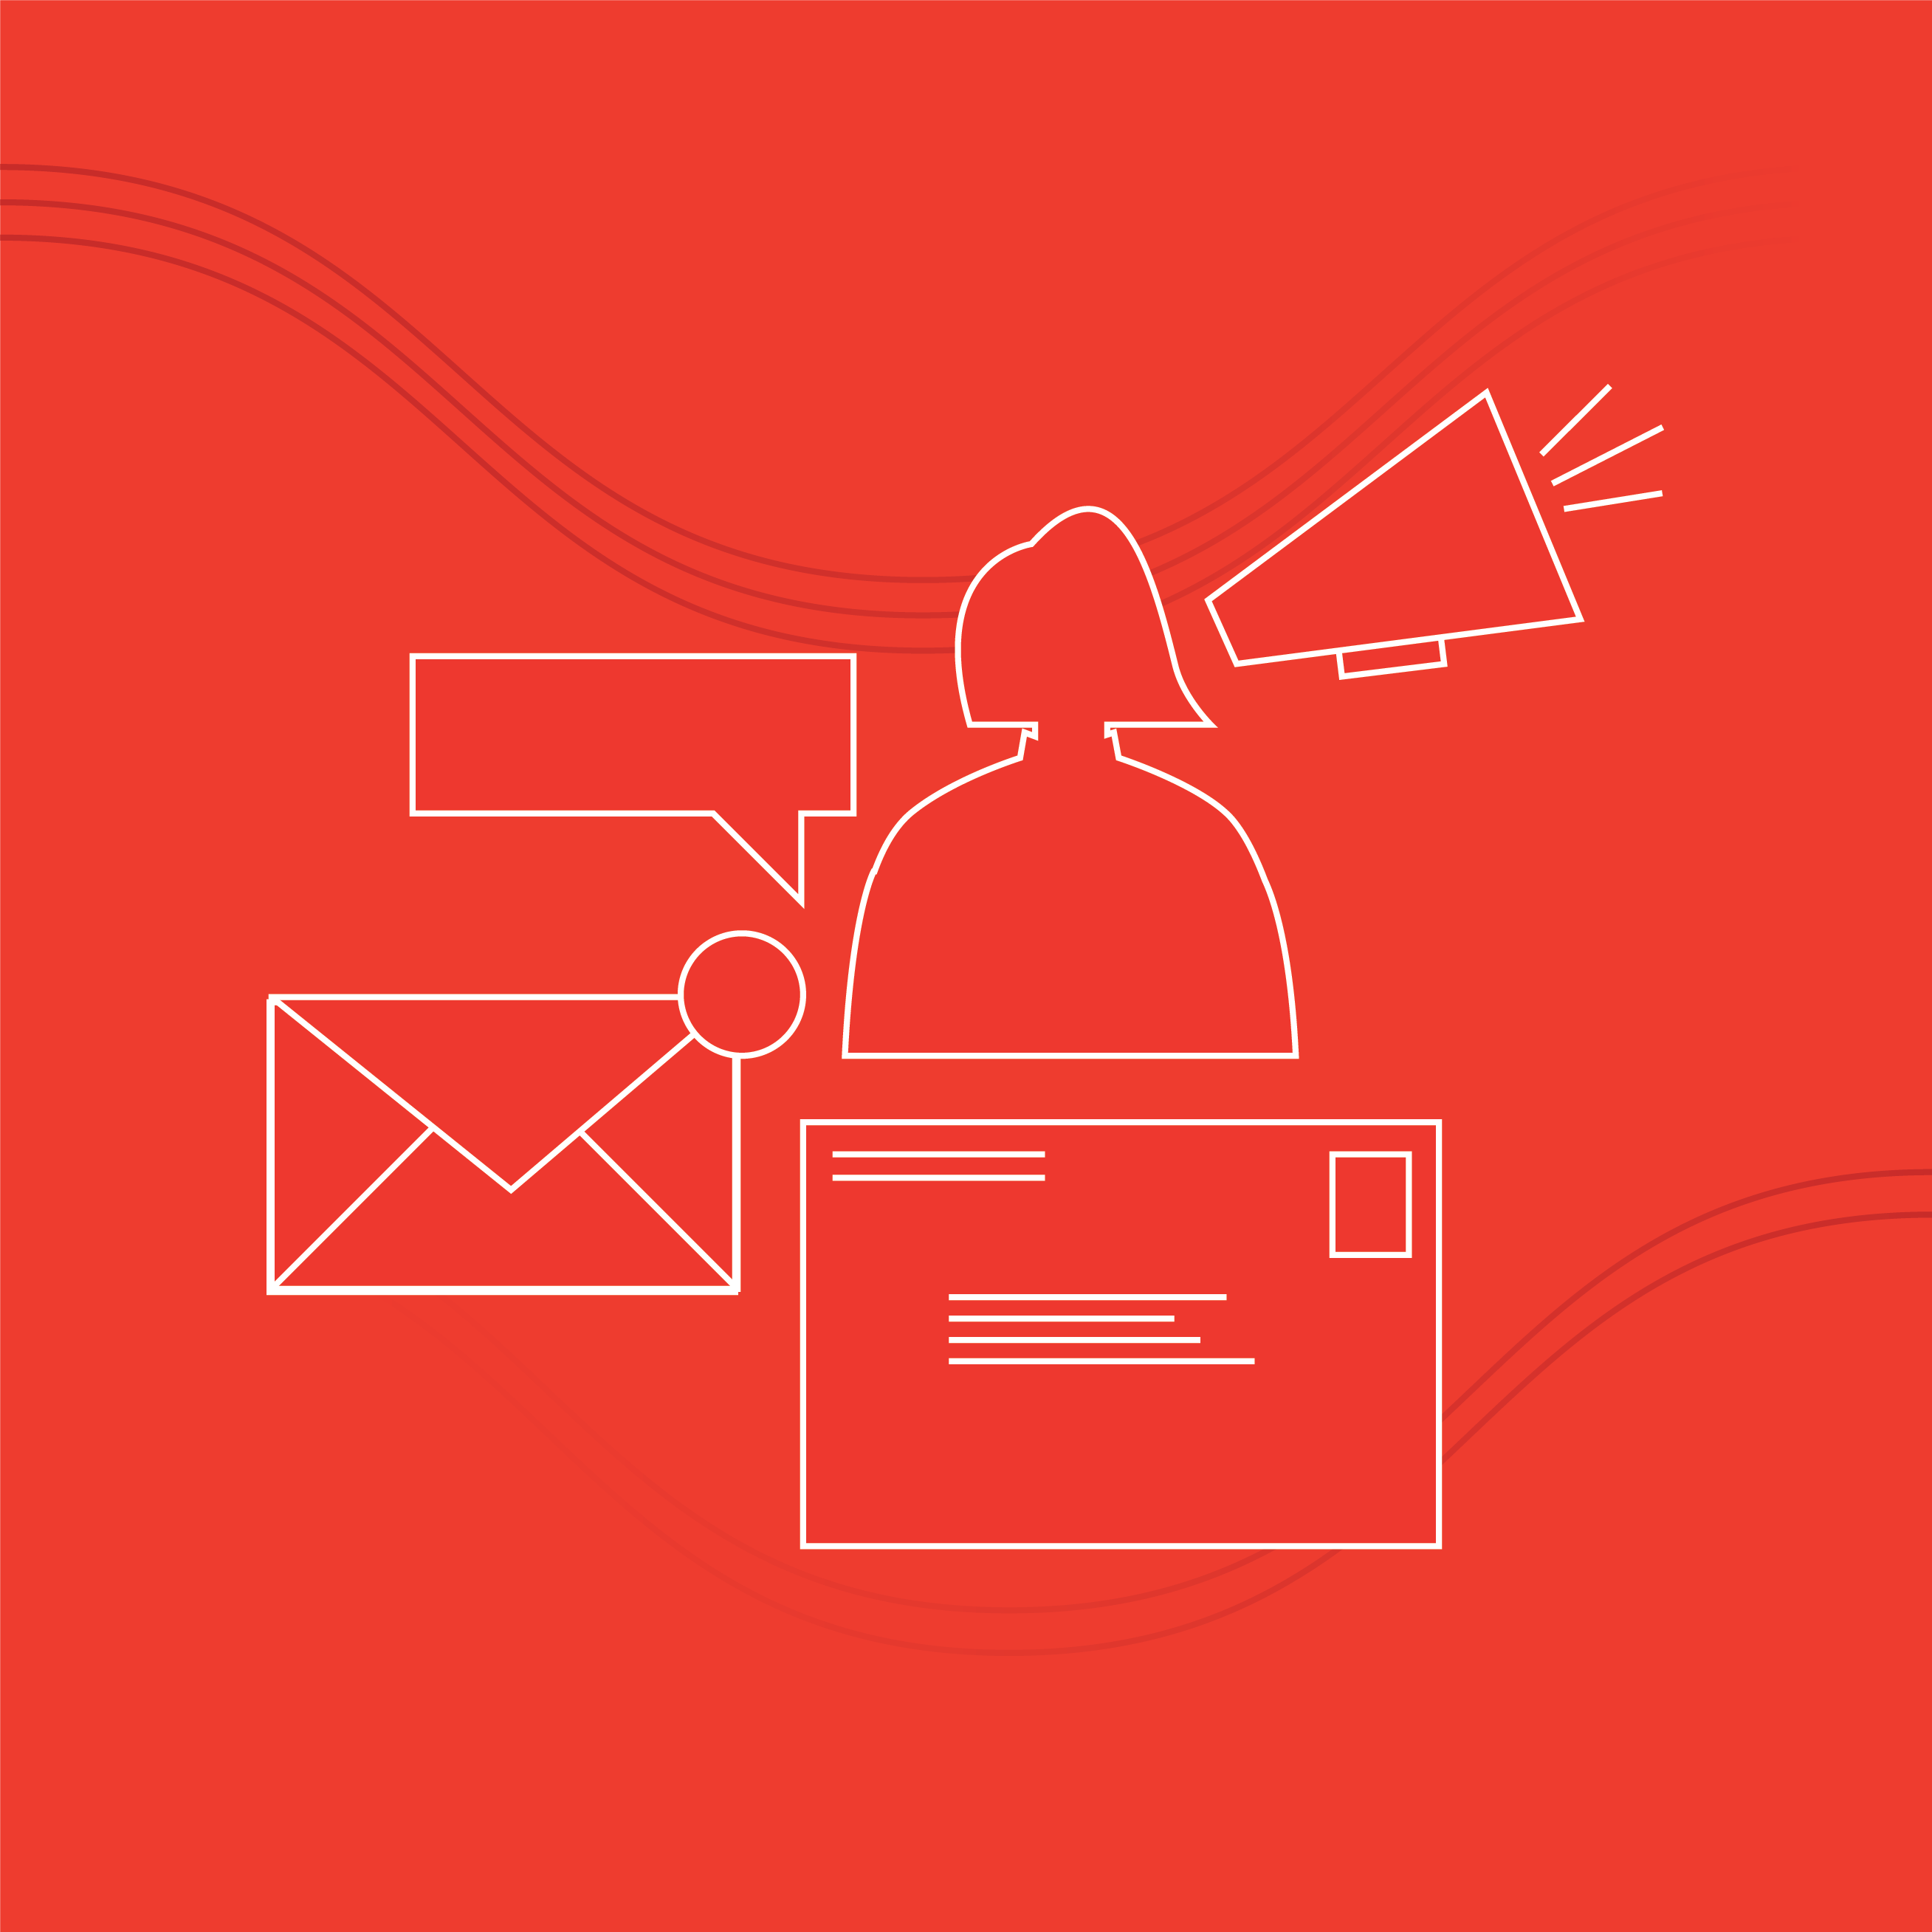
Email is still the top dog. 86% of ticket buyers said they find out about upcoming arts events via email and even more are receiving regular email communications for arts organizations.
NEWS & MEDIA CONSUMPTION
People are letting go of print media consumption and are relying on online news. 92% of newspaper readers also access news online. We’ve tracked the print and digital media trends you need to know.
CONSUMPTION OF TELEVISION & STREAMING CONTENT
56% of patrons who watch TV or streaming content are always skipping commercials. See how your audiences stack up against our age cohort breakdowns.
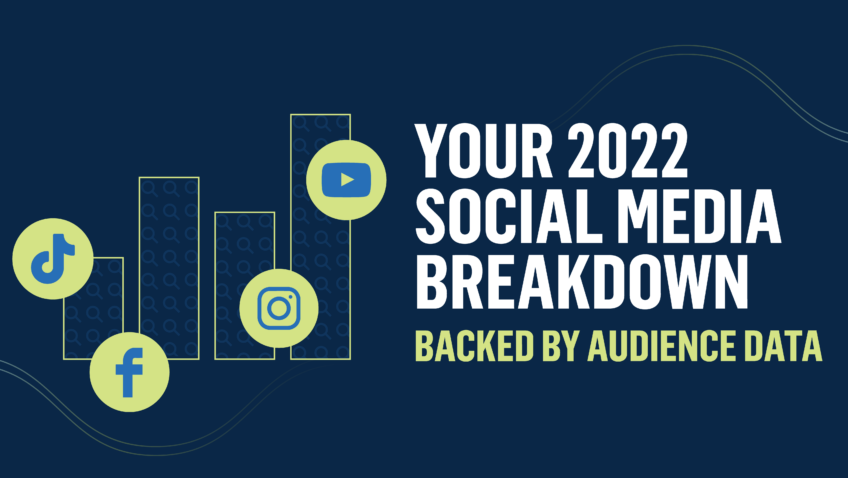
SOCIAL MEDIA USAGE
YouTube and Facebook are used across age cohorts and are the platforms most strongly adopted by the 45+ crowd. For those under 45, their frequency of use on Instagram exceeds Facebook. This year we have new insights into the usage frequency patterns for each platform–and what that means for your segmentation and content.
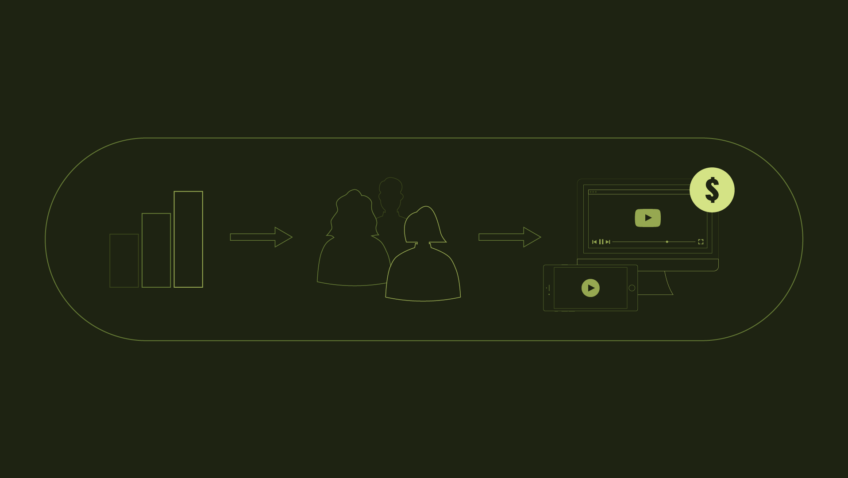
VIDEO VIEWING

Videos embedded in websites, on YouTube, and on Facebook reach the widest range of ticket buyers–but we also have more nuanced data on where particular audience segments take in your videos.
INFLUENCES ON TICKET-BUYING DECISIONS

58% of patrons are strongly influenced by word of mouth from family and friends when considering ticket purchases and 51% strongly influenced by content from an arts organization. See how that compares to the impact of professional reviews and influencers.
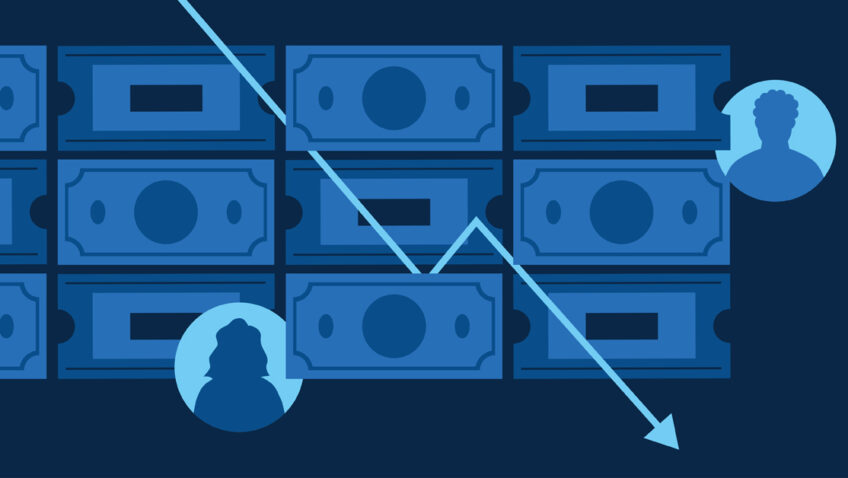
PURCHASE PATH DEVICE PREFERENCES

78% of respondents prefer to buy tickets online, and 52% of those do so on a smartphone. That’s a 34% increase from 2017 and a notable change compared to other devices we measured.
What to do with all this data?
We hope you’ll use this data to grease the wheels of decision-making as you approach your marketing strategy. The data in this study gives a blueprint for where to invest resources and energy and where to take steps to reduce friction that can slow your efforts. It answers:
Who are our most loyal patrons in 2020?
Where are audiences first learning about our performances and what influences ticket-buying decisions?
What social platforms matter and what type of content works on each?
Is advertising in print and on TV a good investment?
What infrastructure improvements will have the biggest impact?
We also explore why patrons are a critical part of your marketing department–and the data points to key areas where you can capitalize on this dynamic, from media channels to marketing infrastructure.
Wait…What’s the difference Between this Ticket Buyer Study and the Benchmark?
CI produces two definitive studies for the field. The Arts Industry Digital Marketing Benchmark Study is a survey of arts organizations across the country that looks at the practices, key trends, and statistics in the field. The Performing Arts Ticket Buyer Media Usage Study, the newest edition of which is now available, is based on a survey of ticket buyers media habits. The Benchmark looks inward at our field while the Ticket Buyer Study looks outward at our audiences, and the data in each adds depth to the other.