Meet the New and Improved Benchmark Study
The Arts Industry Digital Marketing Benchmark Study is available for download and this sixth edition holds a ton of new data to help you market smarter. We rethought our approach to make sure we’re giving you the metrics and key performance indicators that can fuel conversation about growth and help you make informed decisions. It’s double the length of previous versions, since the data’s cut in a couple new ways. Here’s a guide to help you get the most out of it.
What’s New
If you’ve always devoured the Benchmark Study from cover to cover, you’re certainly welcome to do so! But, now you can approach it as an on-demand reference manual for the state of digital in our field. Check out the Guide to This Report in the Study to learn about the navigation tools available.
A great place to start and gain an overview of all the study contains is the Key Findings section. There, you can read the most critical takeaways and jump to the sections that interest you most.
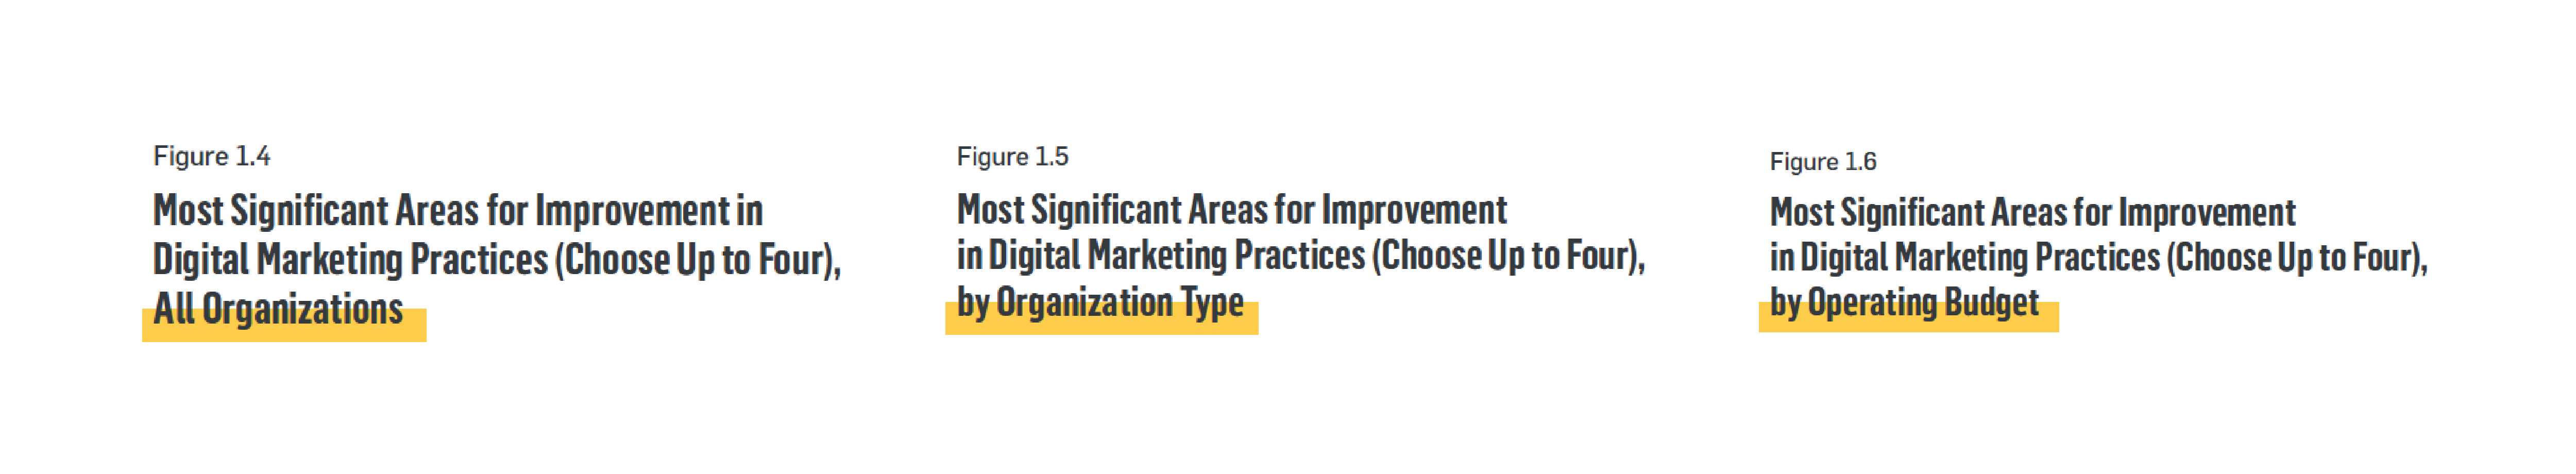
Looking for something specific? The Table of Contents and List of Figures provide a detailed guide to the subjects covered and let you jump right to the data. New this year to better enable you to place yourself amongst your peers, data throughout the report is generally cut in one or more of three ways:
1. All Organizations
2. by Operating Budget
3. by Organization Type
After the introductory sections, you’re into the nine main content sections that contain a deeper look at key findings and many, many more related data points. Those content sections are:
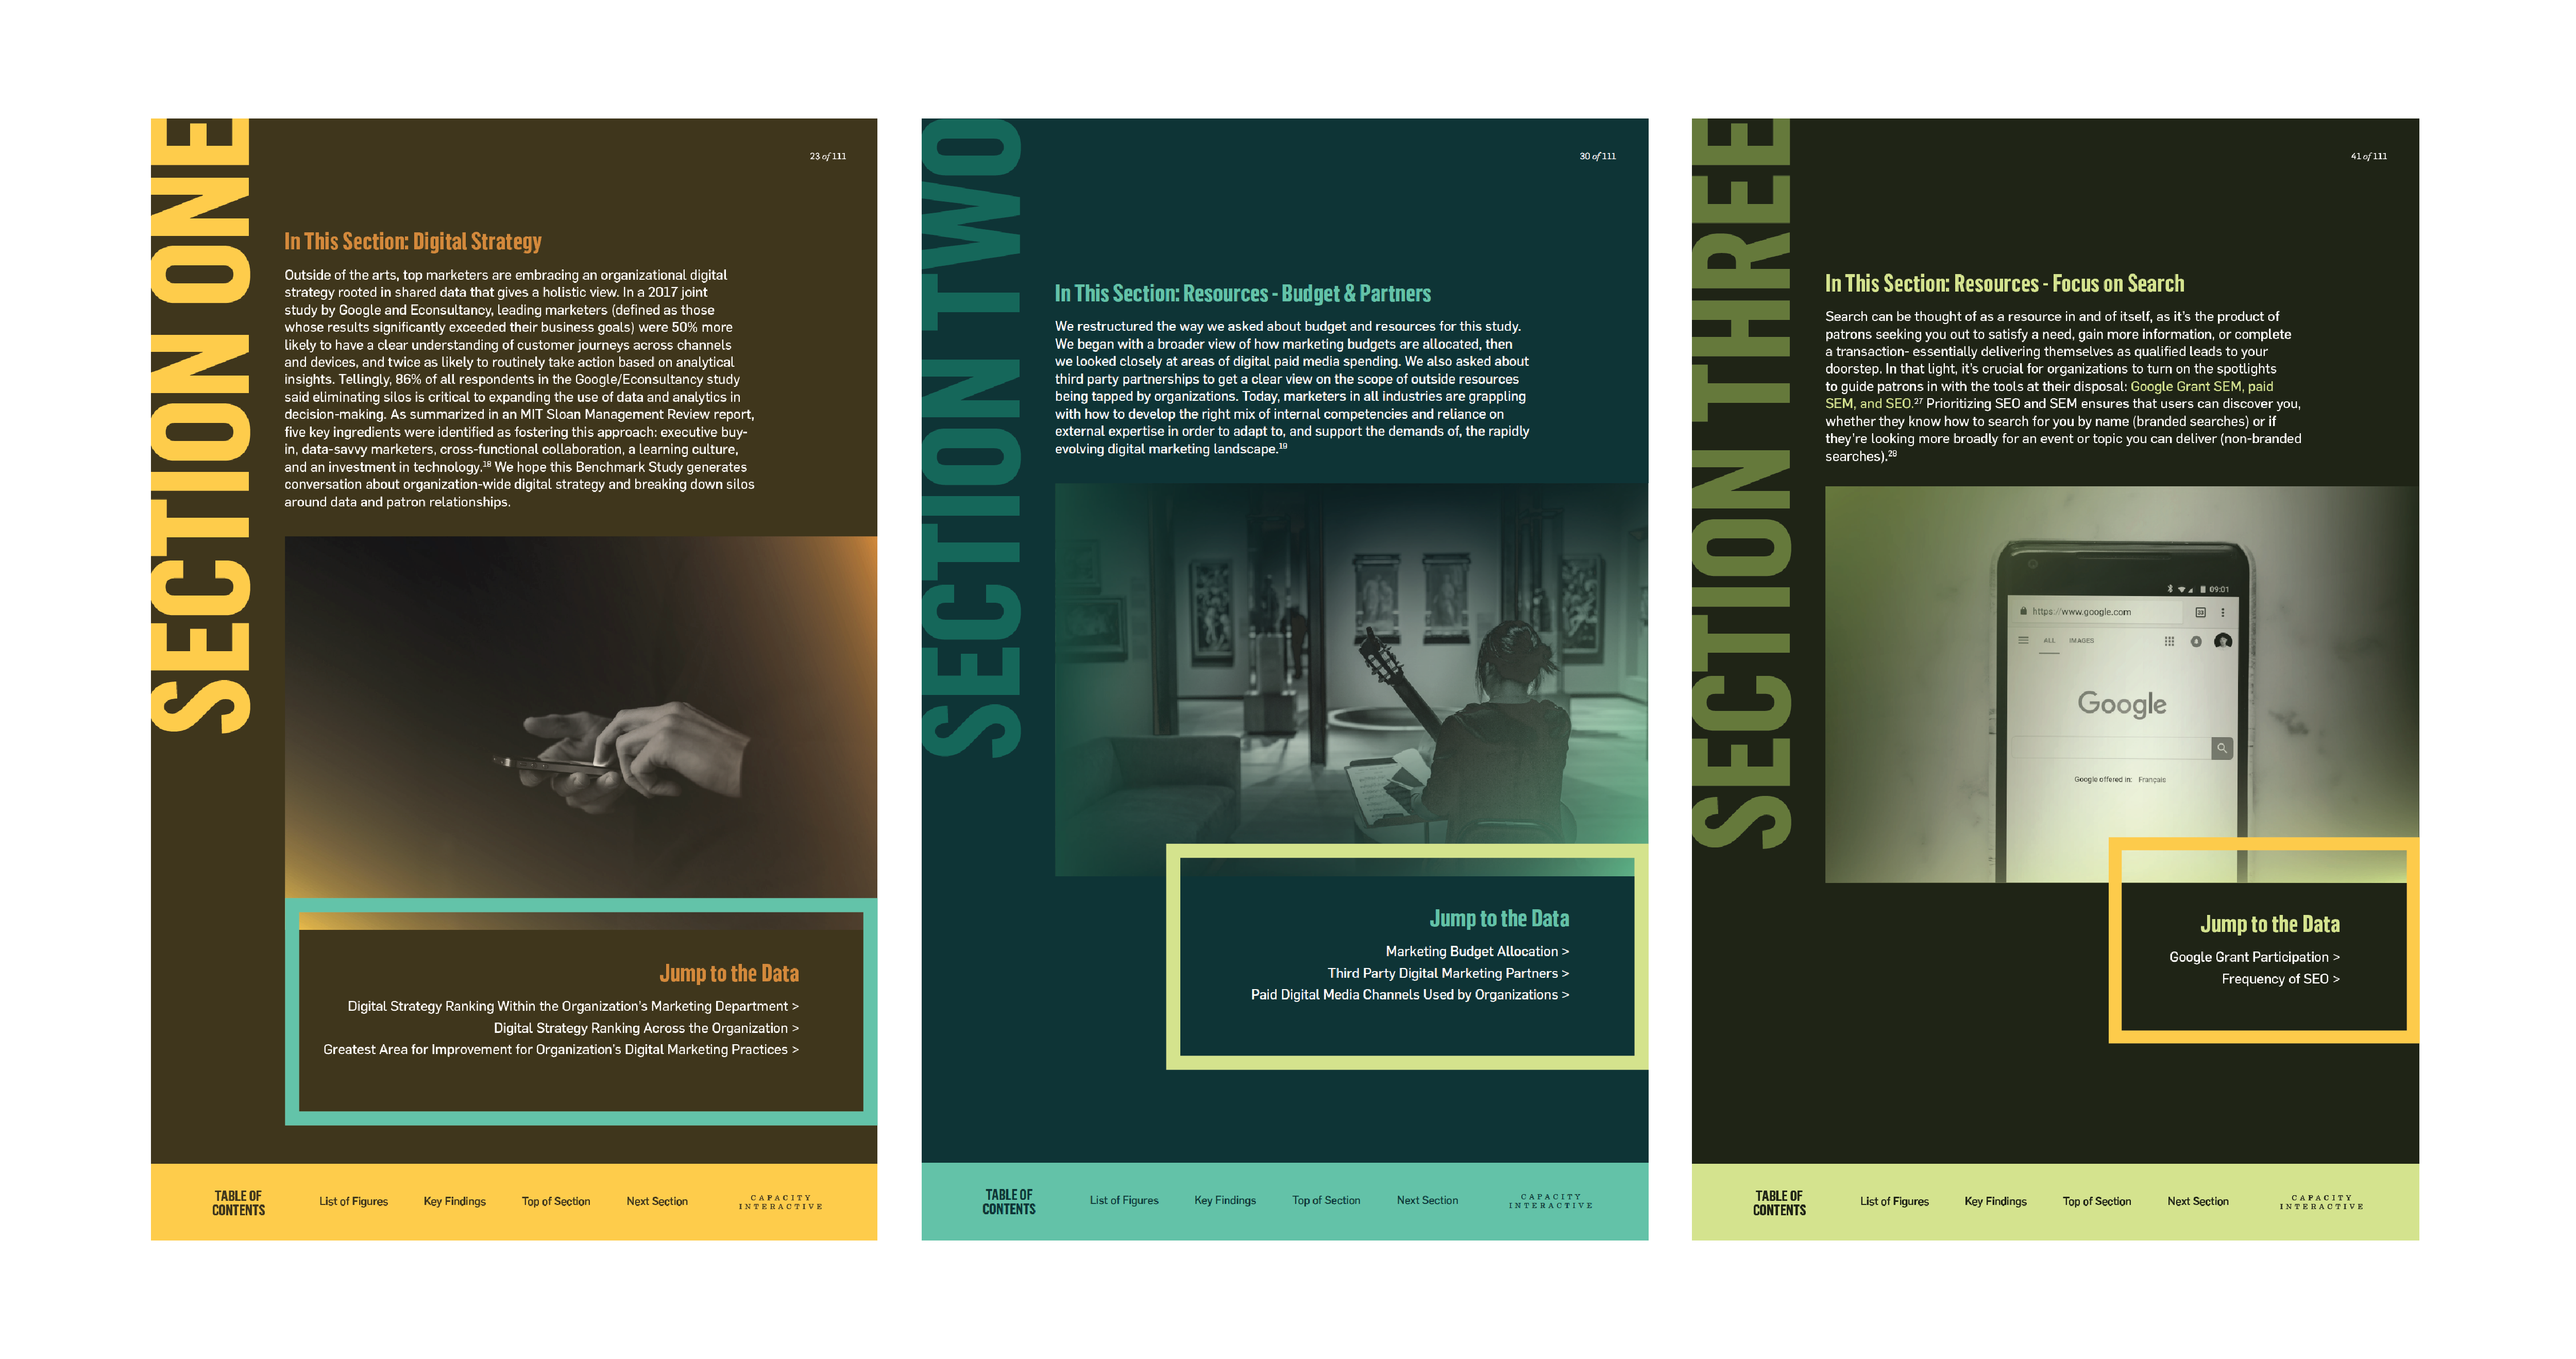
1. Digital Strategy
New this year: you can compare your digital strategy in your marketing department and across your organization to the assessments of your peers, and dive into the most significant areas for improvement for digital marketing practices.
2. Resources – Budget & Partners
New this year: in addition to a close look at marketing budget and media channel breakdowns, see the types of the third party partners your peers are using.
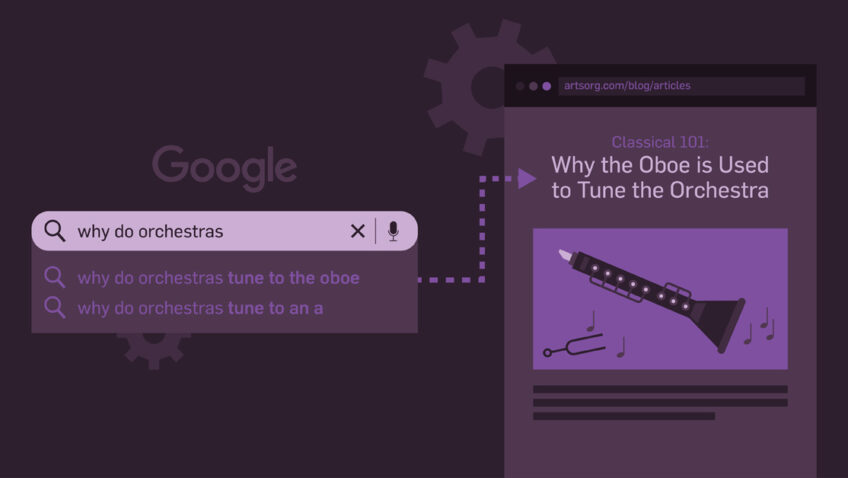
3. Resources – Focus on Search
New this year: see how your peers are approaching all elements of search (Google Grant, paid SEM, and SEO).
4. Website – Patron Path
New this year: after you see how your mobile visitation rate stacks up to your peers, take a closer look at what they’re doing to optimize for mobile.
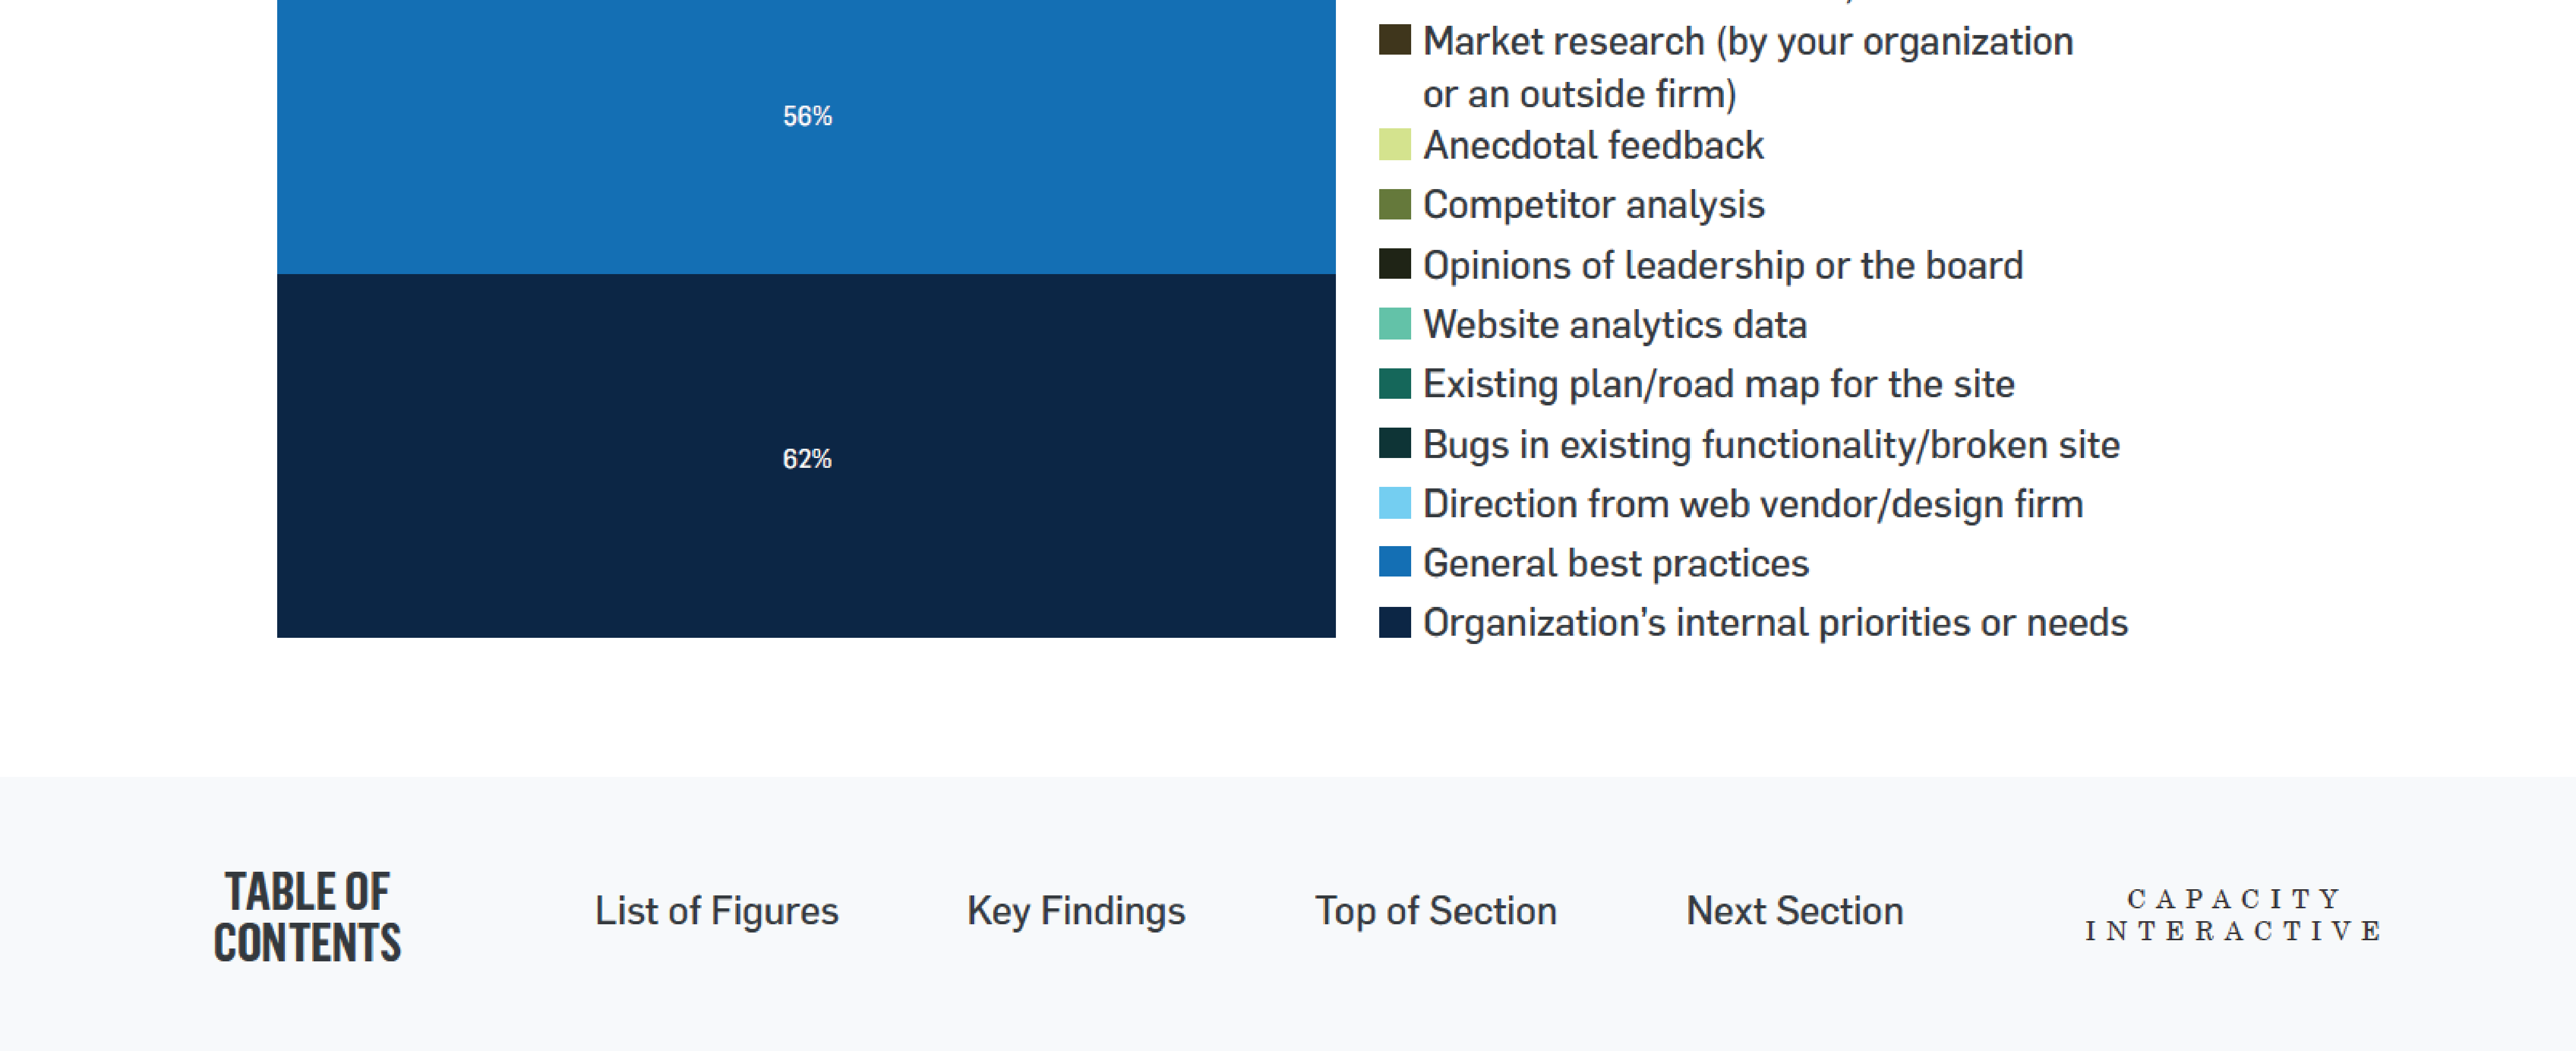
5. Website – Infrastructure & Planning
New this year: you’ll find a close look at the inputs to website redesigns and how website and infrastructure decisions are managed. Do you face infrastructure challenges similar to those of your peers?
6. Digital Marketing Channels – Email & Facebook
New this year: you’ll find an in-depth look at what types of email work best, and get an understanding of which email practices your peers are conducting. Then, see how your email and Facebook metrics compare to your peers.
7. Content – Production & Resources
New this year: see how much staff time and resources your peers are dedicating to content, and how they’re approaching content customization. You’ll also find common challenges faced and the role of professional development for content-related areas.
8. Content – Focus on Video
New this year: you’ll find a close up on video that covers staff resources and video customization practices. How does your video production stack up to your peers?
9. Data & Analysis
New this year: Data and analysis was the top area identified for improvement amongst organizations- is it the same for you? You’ll find a detailed look at how your peers are using data from digital channels, the challenges faced, and the role of professional development for data-related areas.
Look for shortcuts at the start of each of these sections that outline what’s available and let you “Jump to the Data” you’re interested in.
 As you move along, use the navigation bar at the bottom of each page to quickly move to the Key Findings, Table of Contents, or List of Figures; move to the beginning of the section you’re currently reading, or jump to the start of the next section.
Making Sense of the Data
As you read this report you’ll find a wealth of data ranging across all areas of the digital marketing domain. Organizations provided data based on their FY17 (unless a question reflected ongoing practices). While the data can stand on its own or needs limited explanation, it’s often enriched with some added context. We’ve added that context throughout this report in two ways:
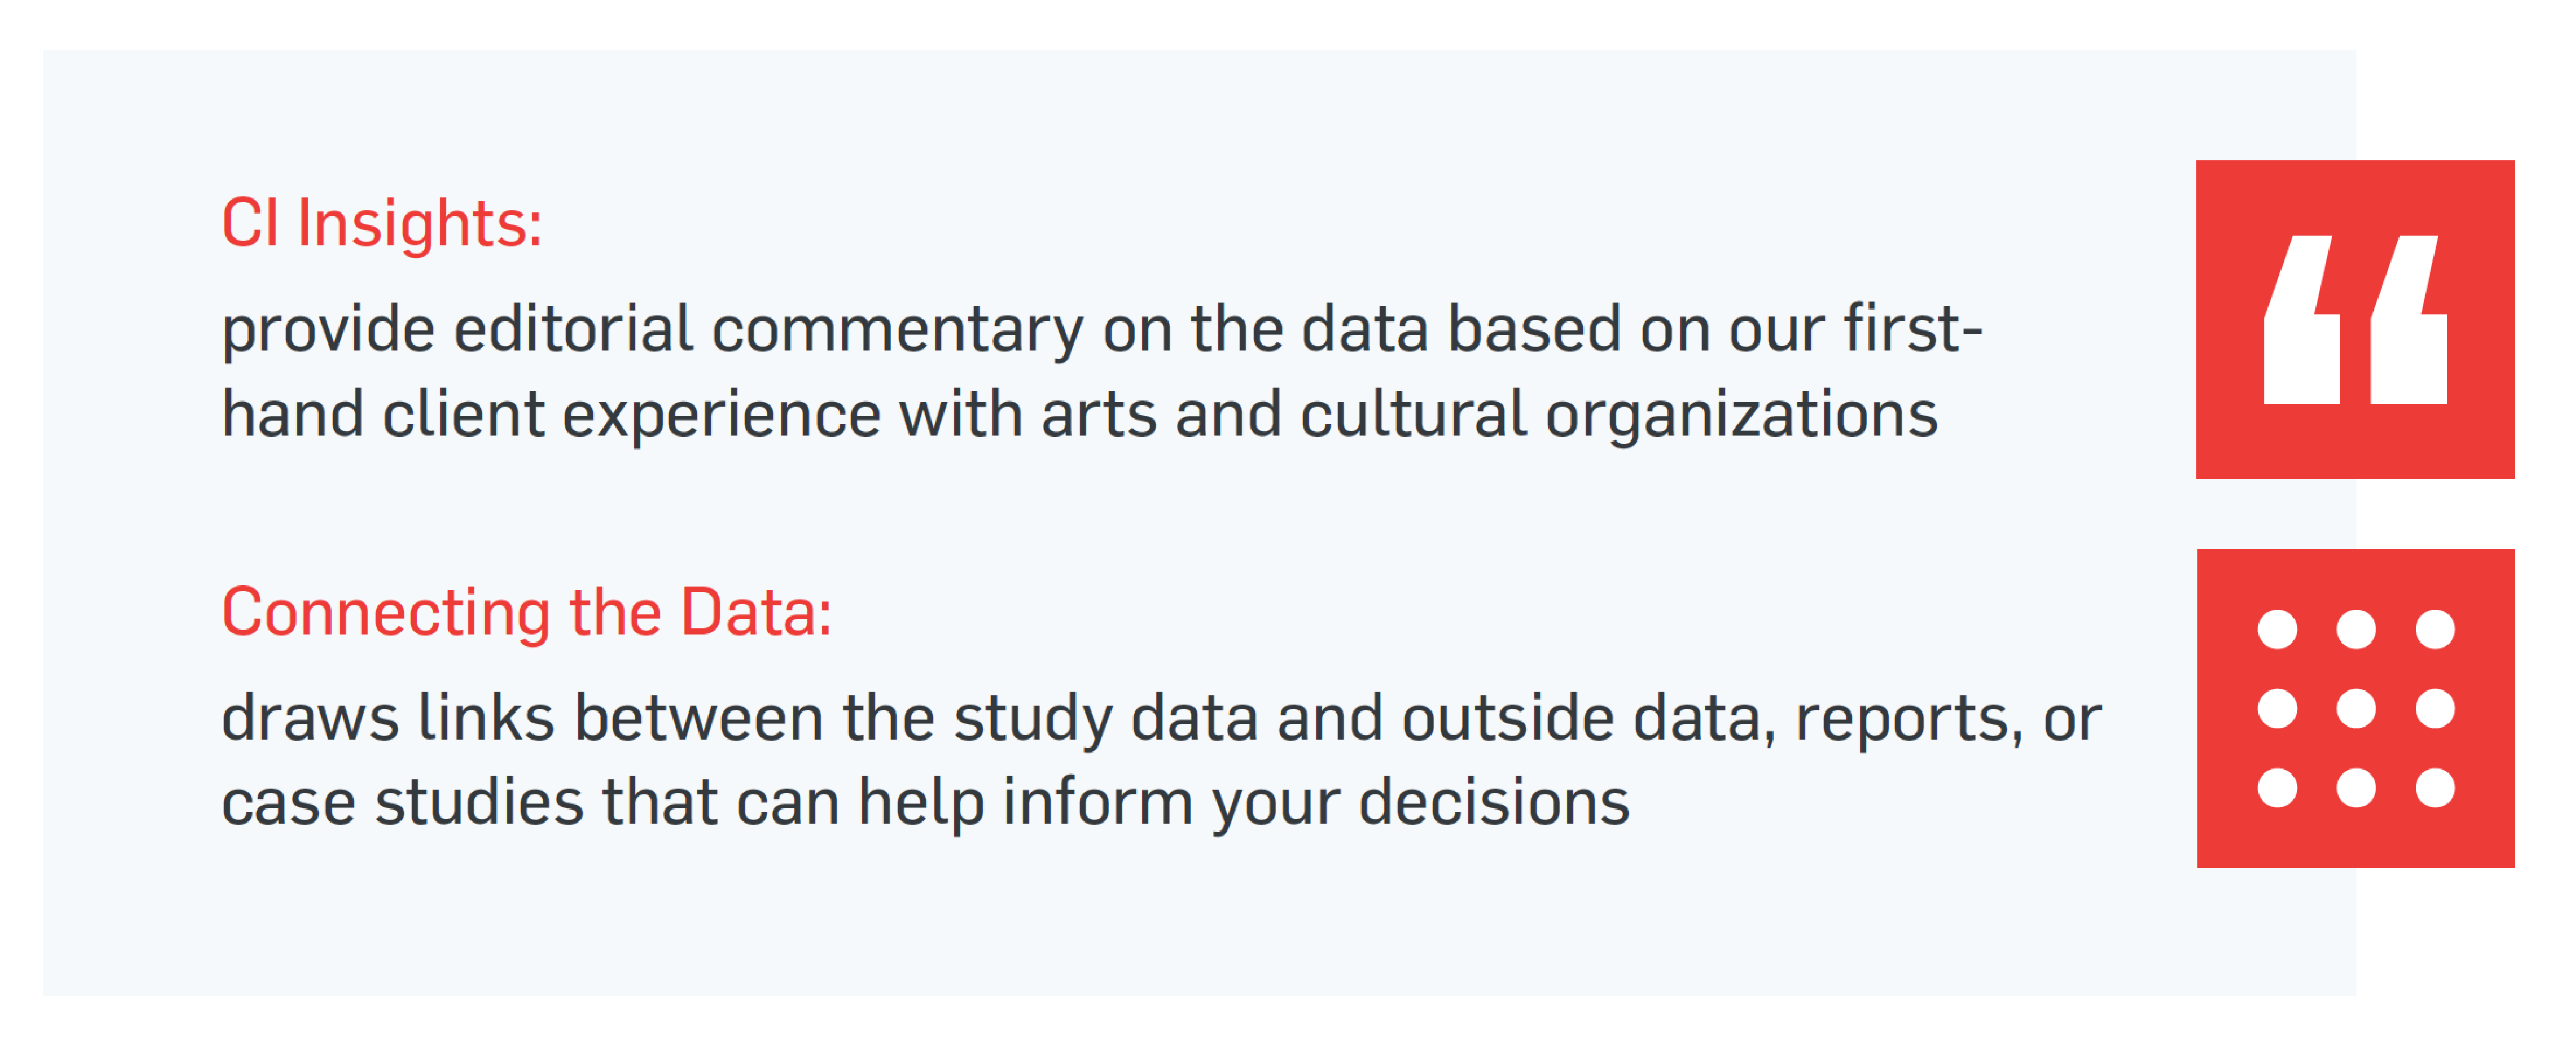
With the debut of our new and improved Benchmark, we’re at the starting line of what we hope will be an ongoing, collaborative effort with organizations in the arts and cultural industry to track digital marketing trends. We’re thrilled to serve this first revamped survey’s worth of data, and look forward to future years when we’ll be able to chart changes in digital practices, resourcing, and outlook by comparing year-over-year trends. Happy reading!
Ready to download the free study? It’s waiting for you!