Improve Organic Social Content Performance with Data Insights

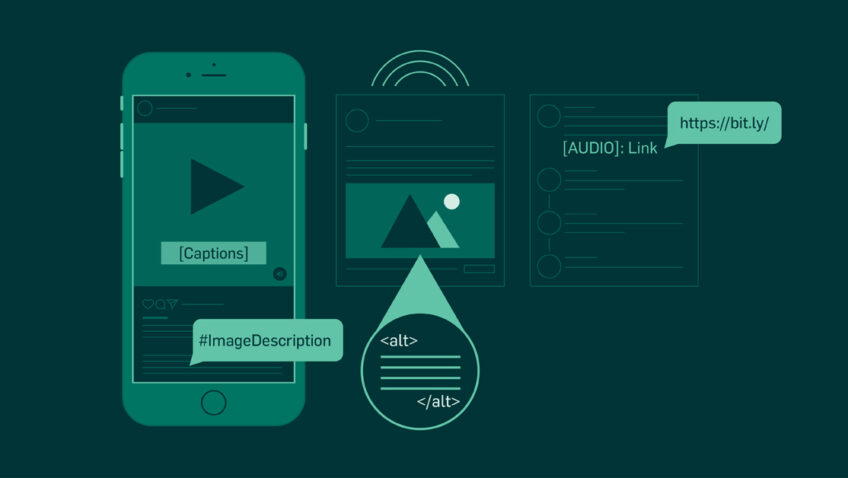
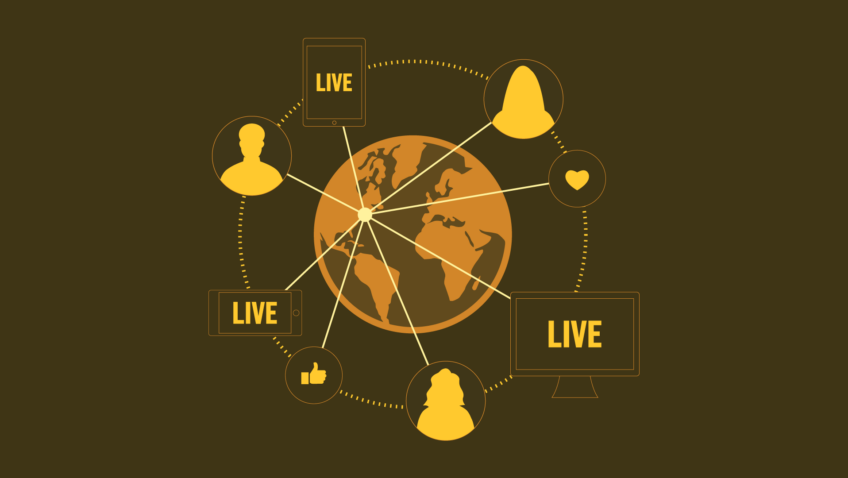
In the midst of a pandemic, arts organizations are leaning into Facebook’s organic features to reach their audiences as they spend more time at home and online. Livestreams, watch parties, video premieres, curated playlists, archival clips—you name it, someone’s probably tried it.
These are incredibly powerful tools to leverage, and like many organizations, the Cincinnati Symphony Orchestra (CSO) saw an opportunity for a strategic shift in how they create and share content. They leaned into organic strategy, devoting resources to the production of content that users could consume from home. This included a variety of projects: a CSO in Concert series provides archival recordings each week, The Fanfare Project premieres new works by living composers, their musician videos highlight musicians performing classic tunes from their homes, and an educational series connects with kids as they navigate their remote learning environment. But new ways of engaging with users necessitate new ways of measuring that engagement to understand and improve upon content performance and user experience.
At Capacity Interactive, we love measurement. There’s nothing better than digging into campaign data and the story it’s telling. For years, we’ve done this on a granular level for paid digital campaigns across platforms, but organic social content performance had been less heavily explored. So we set out to measure the CSO’s organic performance by combining the power of Facebook Insights with the analysis capabilities of Google Data Studio—a match made in digital marketing heaven!
Understanding the Goals
The first step to this type of analysis was to lay the groundwork for what exactly we were trying to understand. Without goals, there’s no real way to define, measure, and track success.
But the process of defining goals and their associated key performance indicators (KPIs) was more straight-forward in a pre-COVID world: oftentimes we looked at ticket sales, revenue, page views. But these KPIs have less of a place in ongoing analysis in recent months. What could we measure instead, and why?
Together, we decided a main goal was to ensure that audiences were remaining just as engaged with the CSO throughout concert cancellations as they were during the peak season. This translated well to the KPIs themselves—namely, engagement rate on both the page level and the post level, which is defined as the number of engagements (clicks, reactions, Likes, shares, comments) divided by the total number of impressions.
In the early months, we aimed to maintain their average engagement rate to be sure that audiences weren’t lost throughout transitional and uncertain times. As the months went on, we aimed to tick that engagement rate up as users became more familiar with the CSO’s various content series.
Another goal was to understand audience preference and to use that understanding to make content better – what types of content led to the highest video view rates? The highest number of post shares? This would be used to help inform content production moving forward, ensuring that audiences were receiving the type of experience they wanted to from the CSO online.
Findings: Organic Reach is Back
The first finding, not surprisingly, was that organic reach is through the roof. This is likely something you’ve noticed on your own page over the last few months, as advertisers began to spend less on ads and users began to spend more time on the platform. According to The New York Times, daily active Facebook usage increased 27% from January to March alone. Since March, the CSO has seen a 250% growth in organic reach year over year—this translates to more eyes on their content, and more opportunities to engage with their audiences remotely.
With our main goal in mind, we’d hope that along with this increase in organic reach there was a consistency in engagement rate. The results surpassed the goal, as engagement rate improved by more than 160% year over year. While initially, our goal was to maintain even audience engagement throughout these transitional months, this significant bump in engagement shows us that the various types of organic content the CSO created over the last few months succeeded in building a newer, stronger type of online engagement for audiences.
Findings: Best Practices Live Up to the Name
Through frequent analysis, we found that there was no discernible difference between the characteristics of top-performing organic and paid posts. For paid social, best practices have long included a clear call-to-action, an eye-catching asset, and short, digestible copy. Exceptional content finds a connection between the organization’s world and the audience’s world—something we like to call the “Social Sweet Spot.” We’ve had ample paid campaign data to back these best practices up, and now organic social results were following suit.
When these same best practices were employed via organic social content, engagement rates skyrocketed. When some or all of these best practices weren’t present, pieces of organic content resulted in average and below-average engagement. This similarity in the way users respond to content is beneficial, as it makes it easy to lift top-performing content from the timeline to leverage in a paid campaign, using organic performance as a predictor of paid success.
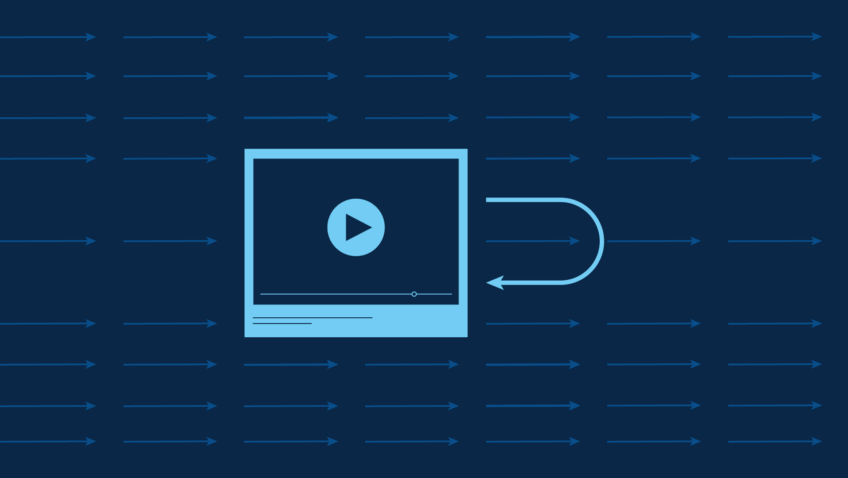
For example, the following piece of content drove the highest number of video views, one of the highest engagement rates, and the highest number of shares of any piece of organic content from mid-March to present.
The video begins with movement and sound, catching users’ attention right away, and the copy highlights a variety of ways to engage without using routine calls-to-action such as “click here” or “learn more.” This pairing of engaging copy and engaging visual have been proven across several months’ worth of content to work together to drive the desired actions.
These same best practices are present in this second example (below), which similarly drove some of the strongest results as both an organic and a paid post.
Another prime example is The Fanfare Project video. Again, the video opens with movement and visual interest and copy is clear and concise—plus it uses its introductory language to acknowledge the changes in the world around us.
This drove the highest video view rate and number of video views, as well as one of the highest engagement rates, of any piece of organic content that was then lifted into a paid campaign.
Findings: Timing is Key
One of the most important and consistent takeaways found throughout this process is that the timing of posts and spacing between posts is key to driving consistent engagement. Post timing and frequency are amongst the most frequently asked questions of us at CI, as organizations strive to understand the best times to post on social media, how many posts should be published per day, and how long they should wait between posts.
There are a host of different resources available to try to answer these questions – try here and here – and the conclusions are always the same: it depends! What that really means is that global data can help inform strategy, but no data is more powerful than your own.
The CSO’s organic Facebook data taught us that their universe responds best to two or more posts per day, regardless of the time those pieces of content are posted, so long as they are posted at least five hours apart. We’ve seen content posted at 8 p.m. drive above-average engagement rates of more than 10%, as long as nothing else was posted until the following day. We’ve seen content posted at 11 a.m. drive below-average engagement rates (3% and lower) if a piece of content had already been published at 10 a.m. Each piece of content needs time to begin to attain reach and drive results before competing with another post from the same page for airtime.
So Why Does it Matter?
The collection of organic data and ongoing analysis allows for iterative changes to content and campaign strategy. As we’ve worked with the CSO to track progress week over week, month over month, we’ve seen their swift response to the data and the way that benefits their overall engagement. Engagement rates and video view rates have ticked up week to week as changes were made based on user behavior.
Most importantly, the impact of this strategic shift and the ability to measure it goes beyond the moment. The CSO has grown their permission base substantially, including a 47% increase in new page likes since mid-March, and a 200% increase in viral reach (or organic reach attained from users who do not follow the CSO’s page). The bump in new page likes means a bump in the number of users likely to see each piece of organic content, and according to Facebook, if a user receives an ad and sees a friend likes the advertiser, there is a 50% increase in recall and a 35% increase in sales.
Viral reach similarly has the potential to improve both organic and paid performance, as now new users are aware of the CSO and can choose to follow the page or can be segmented and advertised via a variety of Facebook’s targeting capabilities as Facebook Engagers or Video Viewers. And as we’ve seen an increase in link clicks and page views in the last few months, we know that the CSO’s website retargeting pools, a key element of campaign strategy, have grown significantly. This means new leads as we head into a new season.
Responsiveness to the data yields benefits that extend beyond the moment, building a positive relationship with new and existing audiences, generating new leads, and setting the CSO up for success as they head into a new season.