Election Season and Ticket Sales
Using Data to Stay Ahead of the Curve
Now that all of the ballots from the 2018 midterms are finally (mostly) counted, the election season has come to an end (though the politicking never seems to stop).
Many arts marketers feel the aftermath of an election season, and spend time trying to recover from a downturn in ticket sales. At University Musical Society (UMS), we call this the “election year phenomenon,” and it’s something we’ve been tracking for well over 20 years.
The difference is that we’re using our data to do something about it.
Testing the Election Year Phenomenon
When I first started at UMS in 1996, we had a simply dreadful fall from a ticket sales standpoint. During one of our Budget & Finance (B&F) Committee meetings, a board member questioned whether or not the election might have been a factor. As a grateful new marketing director, I glommed on to that suggestion as a much-needed and justified rationale for our difficulties.
Fast forward to 2000 when we offered the same excuse, and then again in 2004. The same B&F committee member noted that we always made that observation, but did we have any numbers to back it up?
Being the data nerd that I am, I immediately went back to our sales reports and looked at 16 years of ticket data. I decided to use November 7 as the cutoff date since elections are always held the first Tuesday in November (technically the first Tuesday after the first Monday, so it could be as late as November 8, but I was willing to forego a potential slight data imperfection in the interest of time).
In all honesty, what we found surprised me.
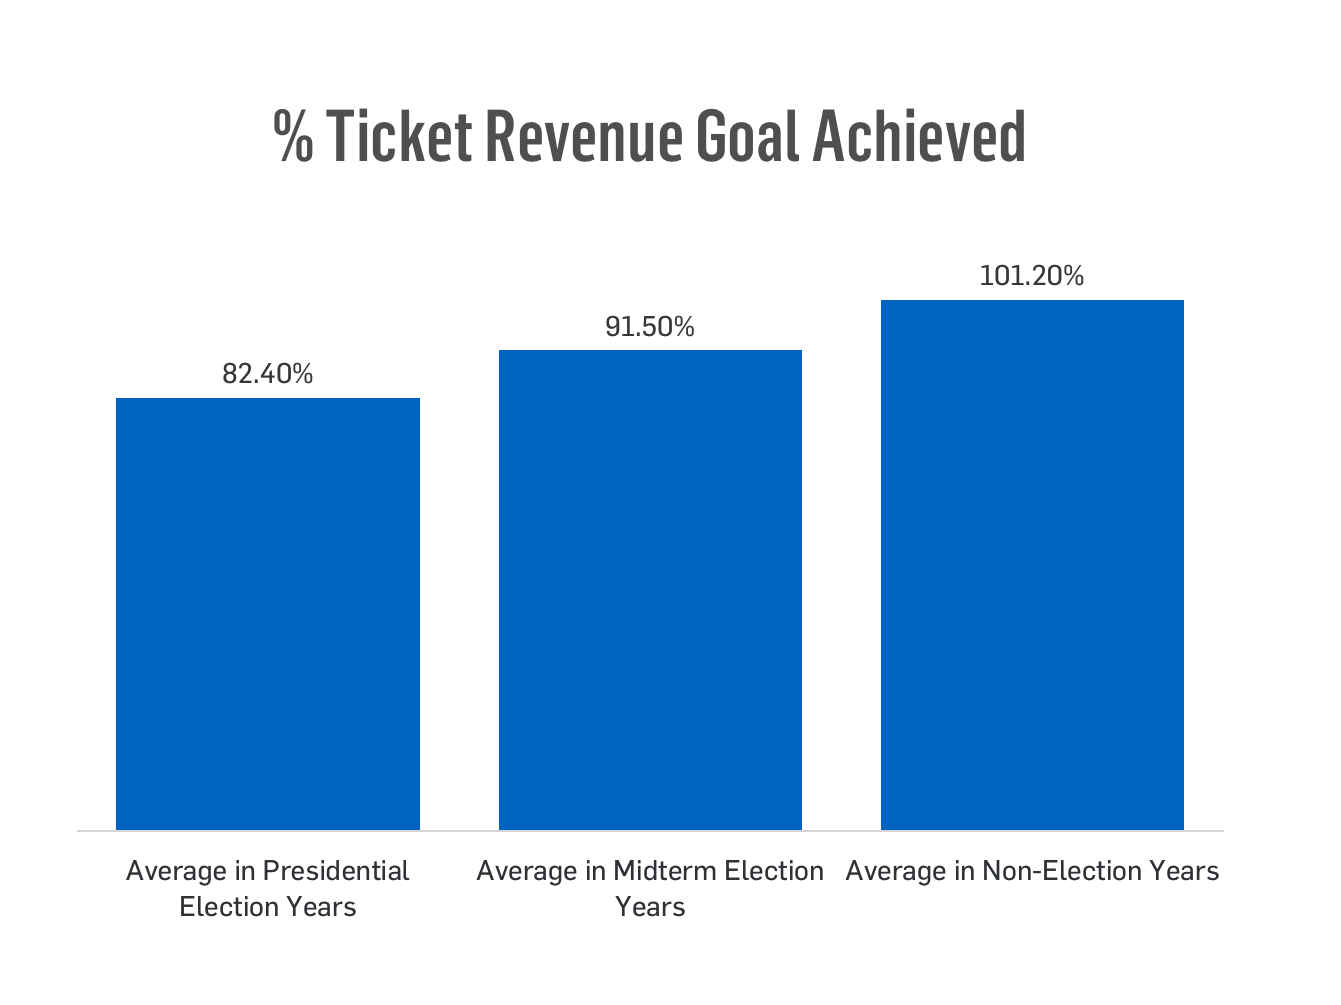
In non-election years (1993-2007), we reached 101.2% of the average budgeted ticket revenue goal, ranging from a low of 91.5% in 1993 to a high of 113.9% in 1995. (Ah, those were the days…)
In midterm election years (Clinton 1994 through Bush 2006), there was much more variability. We hit an average of 91.5% of goal, but the range was 76.7% in 2002 to 109.1% in 1998.
In the four presidential election years we tracked (Bush/Clinton 1992 through Bush/Kerry 2004), we only reached 82.4% of our budgeted goals for events from September through November 7.
Taking Action
When I presented this data to our management team, our programming director was intrigued. We decided to do an experiment.
During the 2008 presidential election, we scaled back our late October/early November programming. We still had two dates in late October that had been committed to a year earlier, but other than that, we avoided programming concerts from October 20 until the election was over.
The results were promising: we hit 96.1% of our goal that fall, which was a far improvement over the 82.4% average that we had achieved in the previous four presidential elections.
During the 2012 and 2016 presidential elections, we significantly scaled back our programming, and the results were positive. In 2016, we exceeded our revenue goal for that period by a whopping 15%. As we’re looking ahead to 2020 (aren’t we all?!), we’re already planning for a blackout period in the weeks leading up to the election.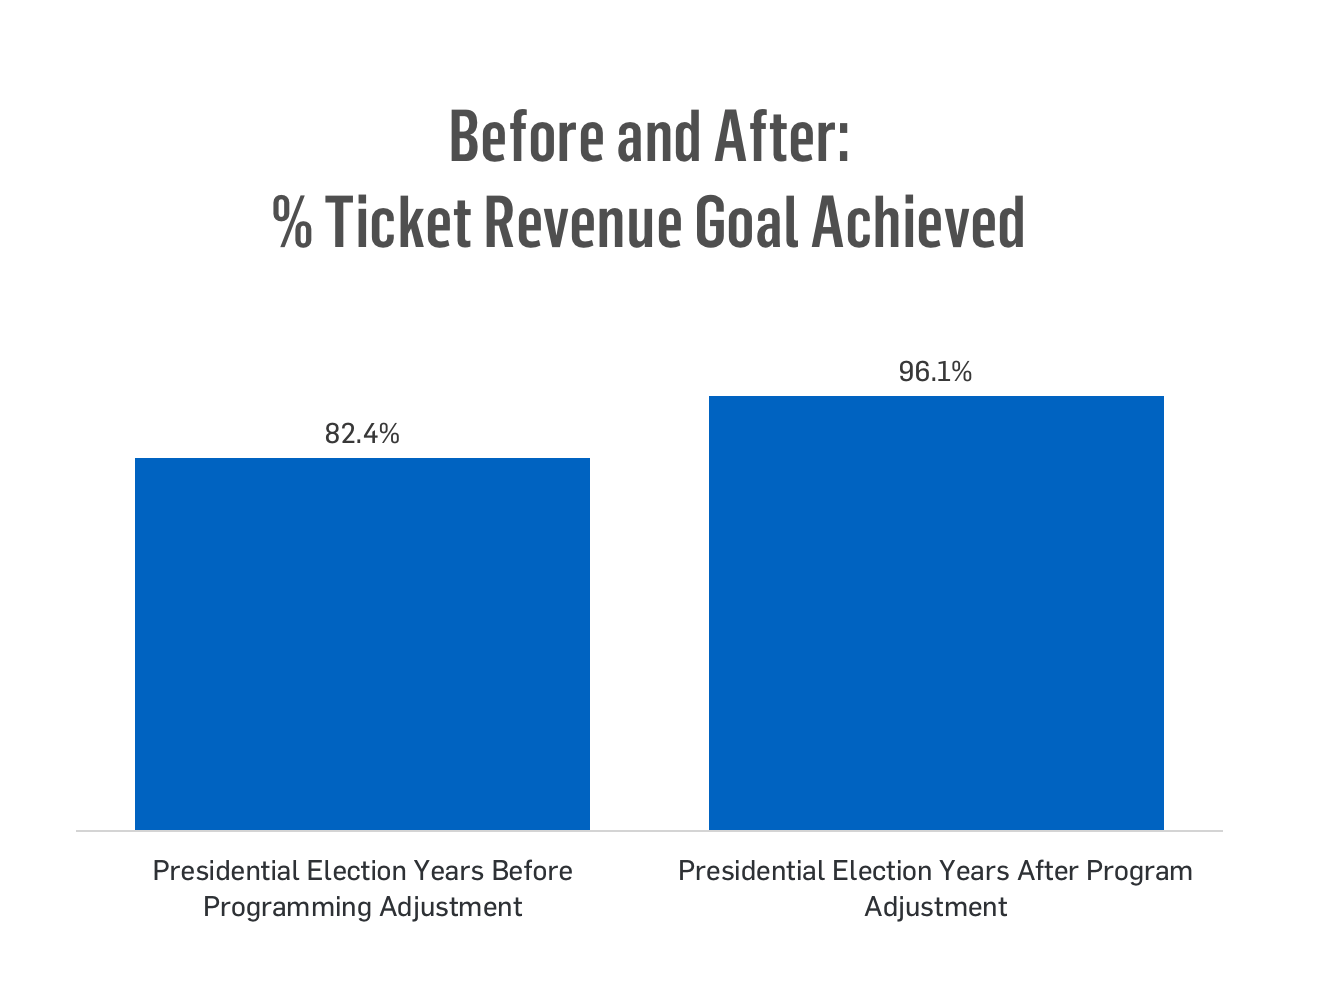
It’s interesting to note that in every presidential election year since we started tracking this election phenomenon in 1992, our sales recovered in the post-election period.
We did better overall in those seasons than we had in the first two months. In eight out of nine years with presidential and midterm elections since 2000, our overall percent of goal improved after the election season ended.
We have not made an adjustment to our programming in midterm election years when the percent of goal reached has been much more volatile. This year, which felt more like a presidential election year given the increased national focus, we realized only 92.8% of our goal. Nevertheless, I’m happy to report that we’ve made up that negative variance. In fact, as of early December, we’re tracking right at goal for the first half of the season. In the future, I will pay more attention to midterm elections and slightly adjust our revenue projections for the beginning of the season.
Rock the Results
So do elections really have an impact on ticket sales, or is this a spurious correlation, like that of the divorce rate in Maine and per capita consumption of margarine?
My theory, admittedly not backed up by exit polls inquiring about arts attendance, is that the drop in ticket sales during election cycles has less to do with money and more to do with mindshare. It’s true that UMS is based in a politically active community, a trait that is common across many cities with universities, and one might assume that people are putting their money towards candidates and issues that they care about.
I believe that uncertainty and mental angst cause the hit to our ticket sales. Our audiences are actively engaged in our communities, and they put time and energy towards causes they care about. The time they spend volunteering and focusing on political races across the country result in a ding on our sales.
Fortunately, we had a management team at UMS that was willing to take these findings seriously. In addition to changing the calendar and reducing programming for the three weeks before the election, I also had a little (and I do mean a little) more leeway to project sales with a slightly more conservative bent, at least for those pre-election events.
I may not be able to predict the outcome of the 2020 presidential election, but at least I know how UMS will be responding with our season programming.
Sara Billmann is the Director of Marketing & Communications at University Musical Society (UMS) in Ann Arbor, MI.