What Do Your Organizations’ Before and After Pictures Look Like?
So your goal is to get in better shape. Congratulations! You come up with a diet and a workout routine and plan to make significant life changes to get fit. Before you begin, you weigh yourself and take measurements to track your progress. Just like in fitness ads, you need a before and after picture. You can’t have a goal weight or waist size without knowing from where you’re starting.
Arts administration is, for better or worse, like healthy living. Some efforts work well, while others just exhaust you, offering little result.
Arts marketers get asked (and ask themselves) hundreds of questions a day about whether the work their department does is effective at meeting organizational goals and financial budgets. Being able to prove success allows for better use of time and resources, with the added benefit of course correcting if initiatives don’t pan out as planned. Data helps tell you if your actions worked.
It’s assuring to report metrics such as, “This targeted campaign brought in 500 new patrons to our organization.”
On the surface, that sentence sounds impressive, but without a reference, it’s utterly meaningless. Arts marketing initiatives need the same starting reference point as stepping on a scale, or knowing how much weight you lifted the last time you were at the gym, or how many calories you normally eat in a day. What did our proverbial scale say about our previous acquisition efforts? While 500 compared to 50 is a huge increase, 500 compared to 450 is less effective and, perhaps, not a worthwhile allocation of resources.
Establish a Baseline
At JCA Arts Marketing, we encourage organizations to consider identifying that starting point, something we call a baseline analysis, in order to establish a reference point and track success.

This baseline might include information like:
- Who is already attending your performances and what are their buying preferences?
- What is typical patron behavior within a season or across time?
- What are the attendance patterns of certain ethnic and demographic segments?
- An understanding of the buying habits of infrequent patrons
- What is the audience’s appetite for certain types of programming?
- Retention and churn rates
Once this baseline is established, you’ll have data-confirmed trends from which to measure the fitness of your marketing efforts.
What You Can Learn: A Real-Life Example
Here is an example of how this sort of investigation can help calm nerves and reduce panic:
Our team worked with a prominent U.S. opera company to try to help them understand if the effects of a programming change (that happened in Season 4) were detrimental to re-subscription, and also if it aided in bringing in new patrons.
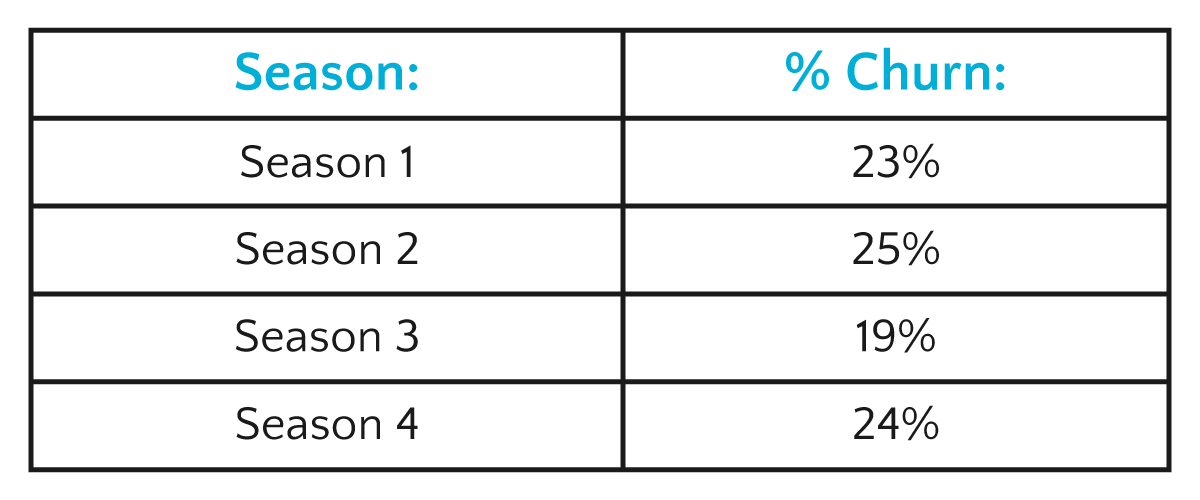
We conducted a baseline analysis that started with an examination of subscriber churn – the loss of subscribers and the addition of new ones each year – in the three seasons without a programming change. We found that overall churn rates didn’t vary much in those seasons. When comparing those churn rates to Season 4 (the new programming season) the rates were remarkably similar.
A deeper analysis revealed that around 25% of lost subscribers did return that year as single ticket buyers. However, around 70% of them did not attend the new programming, leading us to conclude that the new programming may have impacted the decision to drop a subscription. The core programming, however, was of enough interest to not lose them entirely.
We then needed to analyze new patrons in Season 4 and found that over 80% of the patrons attending the new programming were new-to-files and accounted for 50% of the total new patrons for the entire season.
Ultimately, we came to the conclusion that the new programming probably factored into the decision to not re-subscribe, but that the churn behavior fit well within what is typical for this organization. The new programming might not have been as appealing to subscribers, but was very attractive to new patrons. And they now had a baseline from which to evaluate future new programming initiatives.
Before You Move Forward, Keep These Elements In Mind
Before you move your organization forward to a healthier existence keep the following in mind:
- Where have we been? The data is there, you just need to figure out how to measure it and identify what had been the norm.
- Where are we right now? Identify if you’re currently in line with how things have typically trended or if things are vastly different. Then take your “before picture.” This starting point then serves as a snapshot reference for where you are in advance of your new initiatives.
- What is our goal? If you know what wellbeing is for your organization, pinpoint the indicators that will show whether you’re moving toward that state.
Dieting and exercise are a commitment and results may take a while to be visible. But the pounds slowly lost each week and the healthier calories consumed each day – they make the difference. The same goes for your organization. Log your organization’s work and results against your baseline and eventually you’ll have not only the “after picture,” but the documentation and proof of the hard work you did to get there.
Timmy Metnzer is a Senior Consultant at JCA Arts Marketing, an independent consulting firm. JCA Arts Marketing was a sponsor at Digital Marketing Boot Camp for the Arts.