Pages Per Session and Average Session Duration
Important Google Analytics Metrics
Nobody likes to be misunderstood. This isn’t the beginning of an emo song – but rather a guide to help you understand some important, but often misunderstood metrics in Google Analytics (GA). Last time, we focused on bounce rate. Today, we will focus on pages per session and average session duration.
Pages per Session
Pages per Session is a metric that a lot of organizations report on regularly. It’s an interesting metric to look at, but before using it as a definitive measure of success, think about all the possibilities for interpreting what it means.
More Pages per Session means people are engaging with more of our content, right?
Maybe, but from this metric alone we can’t say if that’s true. Let’s think about one of the major goals of web design and user experience design: to get users where they need to go in the most efficient way possible. What if more pages per session doesn’t mean that users are consuming more content, but that they’re just lost on your site trying to find what they need? Are they confused about how to purchase? Is ticket information buried in a complex header navigation? Maybe that’s not the case, but we should consider that this metric falls short in telling the whole story about site engagement.
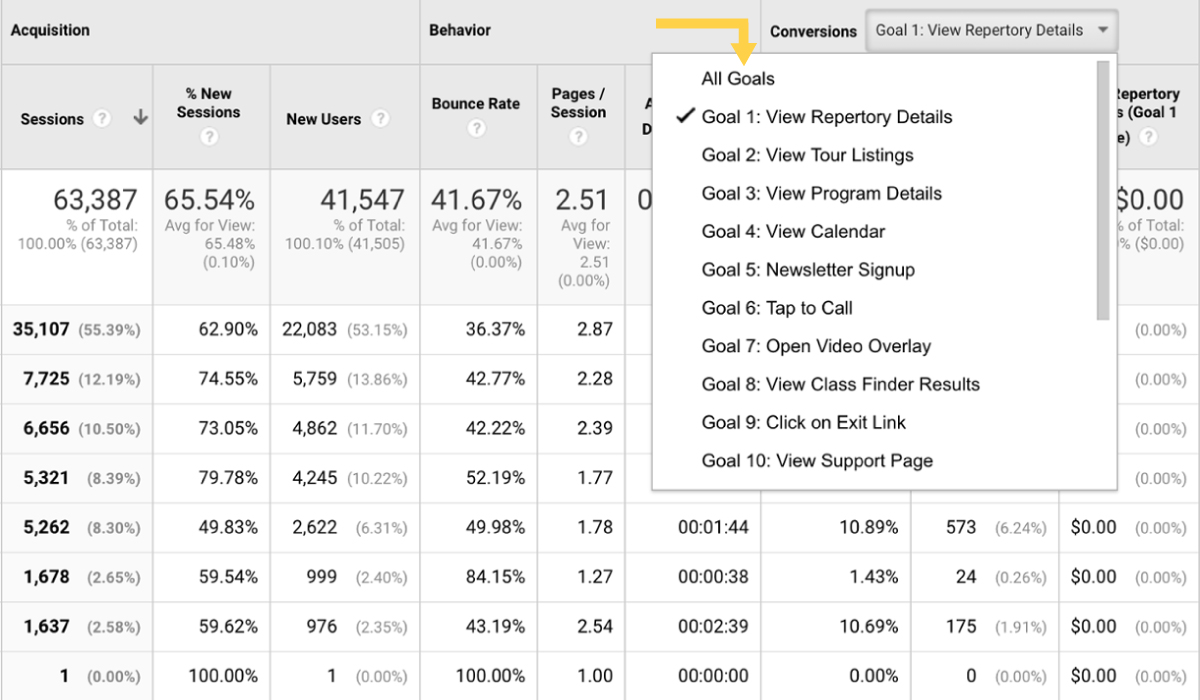
Instead of asking “How many pages in a session?” ask, “How many performance detail pages will someone see in a session?” or, “Are users watching the video content on my site?” or, “How many sessions visit the blog?” These behaviors can be measured using Custom Goals, which is a powerful feature in GA that integrates with many key reports.
Average Session Duration
Capacity Interactive hates ‘Average Session Duration.’ There, we said it! OK, maybe ‘hate’ is a strong word, but we stay away from this metric when doing any type of analysis in GA for two reasons:
- Like Pages/Session, it is difficult to interpret. What does it mean that users are spending more or less time on the site? Are they actually reading more content or watching videos, or is the purchase path over-complicated and they’re taking a long time to check out? We don’t have the full story, so we can’t have reliable analysis.
- GA is unable to record accurate time spent on the final page of a session because of limits in how data is collected. This renders the metric largely unusable, since we’re missing an entire page of the user’s experience, and bounced sessions (since they’re only one page) are not included. Let’s use an example to help clarify:
- If I’m on the Homepage for 10 seconds, and the Event Detail page for 5 minutes, my time spent is recorded as 10 seconds, not 5 minutes and 10 seconds.
Additionally, when someone opens a new tab for your site, the clock starts on their session time, even if they’re wrapping up an Amazon purchase or a New York Times article in a different tab. Frustrating, right? Both data collection issues also apply to the Average Time on Page metric.
Instead of asking, “How much time do users spend on the site?” ask “What sections on the site are the most popular?” or, “Where do users go after they look at the season listing?” or, “How likely are users to sign up for my newsletter once they visit?” These are questions that can be answered with accurate measurement, and help us better understand site engagement.
If measuring time on site is a top priority (e.g. if you have a content site and want to gauge content consumption) there are ways to get at a more accurate measurement – but those aren’t part of a standard solution and require a custom implementation using Google Tag Manager. (If you’re interested in learning more about a custom implementation, sign-up for a free 30-minute GA assessment).
Fully understanding these important GA metrics will help you interpret your data in a more meaningful way. GA metrics aren’t always as straightforward as they seem, but they don’t have to be a mystery if you understand what they are, consider context for each, and allow them to be pieces of a greater data story.