Your Google Analytics Life Jacket
Don’t Get Lost in a Sea of Data
Getting started with web analytics can be paralyzing, and understandably so. It was for me at first! I made the transition to CI’s Analytics team after working on one of our digital marketing consulting teams. I went from specializing in advertising platforms, like Facebook and AdWords, to web tools like Google Analytics and Google Tag Manager. My job is now to help you understand what users do once they get to your website, rather than how to get them there in the first place.
But I wasn’t always a Google Analytics geek. Even before my time at CI, when I was working at a performing arts organization, the most I knew about Google Analytics was how to log in. After that it was a lot of shuffling around in the dark. I didn’t know where to start so I just ignored it and pretended it would go away. Not an approach I’m proud of, nor one I would recommend.
Raise your hand if this is also your approach. Don’t be shy! You’re not alone. More than 90% of arts organizations say they aren’t using Google Analytics to its full potential.
Why does this happen? Let’s be honest – free platforms, like Google Analytics, can be intimidating with many reports, metrics, and confusing charts and tables. On top of that, there’s a common feeling among arts administrators, many of whom come from humanities backgrounds, that we are not “numbers people.” We tend to shy away from tools that look like they were made for computer scientists.
Google Analytics is one of the most critical platforms for digital marketing – and it needs people to make it valuable. Otherwise, it’s just a tool. If you’re serious about learning this platform, here are some actionable steps to help you keep your eye on the GA prize.
Google Analytics was Built for Marketers, Not Data Scientists
Google Analytics was built for you, not for the Harvard Department of Computer Science. These are tools for marketers that need a bit of translating. For example – take a look at the sidebar.
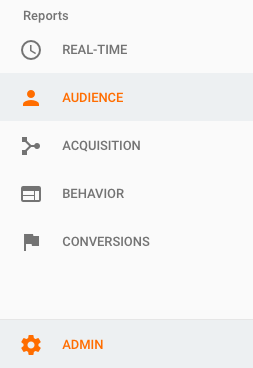
Here’s a quick breakdown of what’s inside some of the key sections.
Audience: Who are the people coming to my site? What do they look like? Where do they live and what device are they using?
Acquisition: How are they getting to the site? What channel brought them here? Was it one of my campaigns?
Behavior: What are they doing once they get to the site? What pages are they visiting? What actions are they taking?
Conversions: Are they meeting my site objectives? Buying things? Completing other significant goals?
When in Doubt, Take One (Or Three) Steps Back
There are a ton of reports in Google Analytics and you may not be sure which ones you need to look at on a regular basis. At this point, it can be helpful to take a deep breath and ask yourself, “Why do we have a website in the first place?”
For many of us, the primary objective of our website is to sell online tickets. For some of us, our website has additional or different objectives: to be a home for community resources, to showcase exhibitions, or to house archival information.
All analysis should come back to these primary objectives, and all reports and metrics should help you understand if your site is meeting these objectives. If your primary goal is to sell tickets, you should definitely look at purchase conversion rate, revenue, and number of site sessions. If your primary goal is to provide educational information, you should be looking at visits to those education pages, file downloads from that section of your site, or video views.
Once you’ve outlined your primary objectives, you should set-up a customized Google Analytics dashboard based on these objectives. The dashboard will track your KPI’s (key performance indicators) and help you easily monitor site performance and identify trends as they are occurring.
Take some time to think carefully from a 10,000-foot view. It will save you many panic-stricken hours looking at every single report in Google Analytics if you know what your priorities are.
Analytics is a Process and a Mindset
Like mastering any new skill, this takes time. No one becomes an expert overnight. As arts marketers, we’re pulled in a hundred different directions every day, but devoting a consistent amount of time to analytics will leave a lasting positive impact on nearly all aspects of your work.
Websites are one of the most important marketing tools at our disposal. Think about the cost of never understanding how users engage with it. Who is your web audience? What are they doing when they get to your site? The answers to these questions save time and money down the line when pricey conversations about redesigns and digital campaigns come up. Yes, learning a new platform will take you some time, but it’s worth it.
Teaching Facilitates Learning
Research shows that the best way to learn is through teaching our peers and colleagues. When we teach, we think harder about why things are the way they are, retain them, and use the knowledge more often. When you uncover something new in Google Analytics, share it with a colleague who might find it useful. Not only will it reinforce what you learn, but it’s one of the best ways to get buy-in from coworkers so you can move forward together in making web analytics a priority.
It’s easy to think that Google Analytics is a sea of data that you won’t be able to conquer. But remember – it’s a tool to help you understand website behavior so you can make data-driven decisions to improve website performance. Mastering these skills takes time and practice. Now that you have some actionable steps, log-in to Google Analytics and don’t just tread water – swim with (data) confidence!