5 Reasons You Should Take the 2017 Benchmark Survey
At Capacity Interactive, we work with nearly two hundred arts and cultural organizations and have the privilege of tackling challenges in the digital marketing realm with them every day.
Certain questions come up again and again across all organization shapes and sizes, and that inspired us to retool our benchmark. Some of the toughest questions for organizations involve where to put their money, how to staff their teams, and how to set priorities when there is always more to do.
We’re throwing back the curtains to shed light on the state of the field and the decisions organizations across North America are making. With this new data, all will be able to assess where they stand amongst their peers, get ideas for where they can grow, and tackle common challenges.
The Arts Industry Digital Marketing Benchmark Survey is open and collecting data now, and we need you to make this the best study yet.
If that’s not enough to get you excited, here are our top five reasons to run right towards this year’s benchmark:
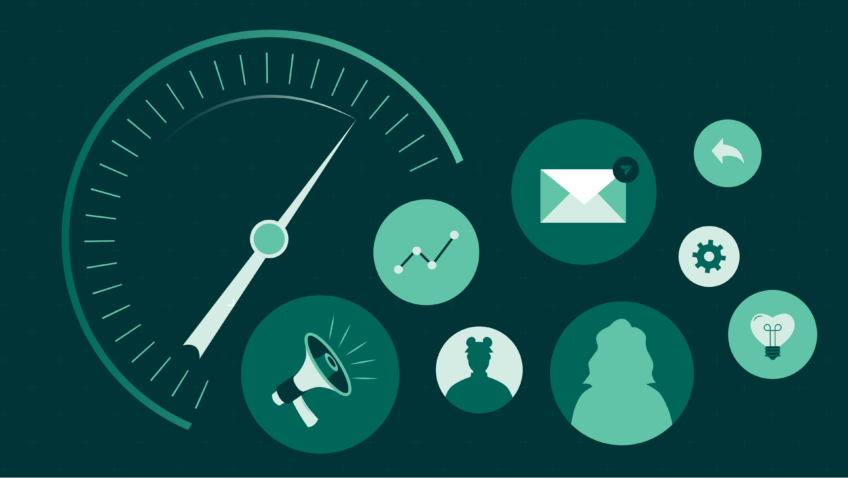
1. A focus on content, resources, infrastructure, and data
The most common question we get at CI is “how much should I be spending on x,y, or z.” We understand the dilemma- many marketing teams are in the process of becoming more fully-tooled for digital practices and they’re trying to cover all bases with tight budgets and limited info.
We’ve built the survey to collect data so you can navigate today’s resourcing questions, including:
Budget allocations and staffing for creative and content production, paid media operations, and data analysis.
What exactly is being outsourced to partners.
How digital infrastructure is being managed, with a particular focus on the website and mobile.
The ins and outs of digital strategy, how data is being used to inform it, and how organizations are collaborating across departments.
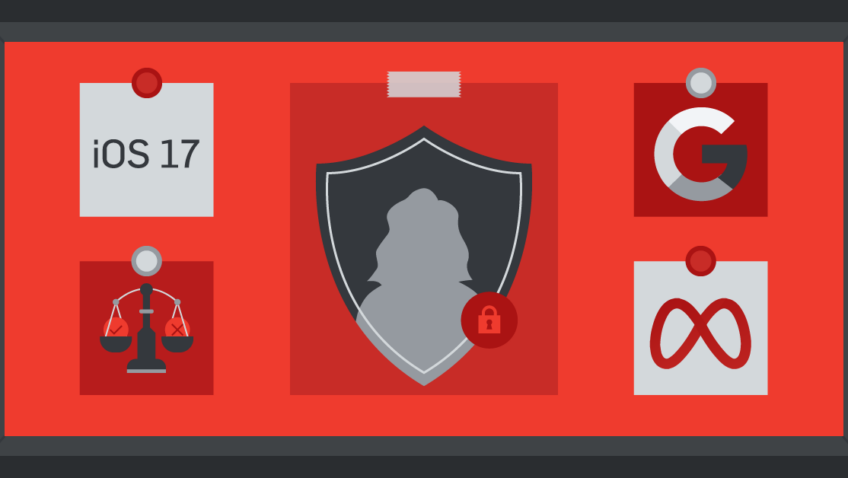
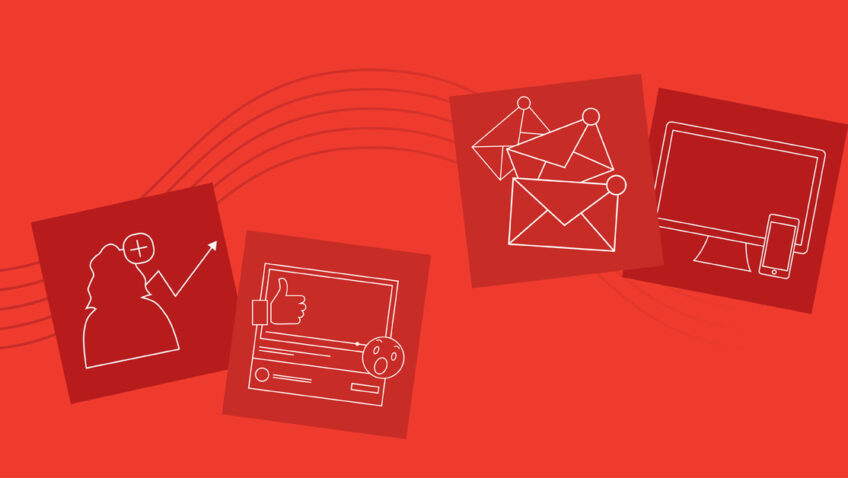
2. All the hard-to-find comparative metrics around paid digital, video, social, and email
As with past benchmark surveys, we get the details on where digital paid media allocations are going. We also look closely at website traffic, social media, email practices, and ask new questions around video creation and its use.
This year’s update brings a focus to segmentation and customization of content for audiences across these channels as well as an emphasis on what’s driving media decisions.
3. Less data to find (…okay, the instructions look long, but we promise!)
We know we’re asking for your time and attention to fill out this survey, and we’ve made sure the instructions give you all the details you need so you can smoothly pull the data needed. To make it easier, we’ve asked for data based on fiscal year and we’ve trimmed the survey overall.
4. Focus on creating a strong methodology
One of our commitments to you is that we’ll give you the best insights we can. To do that, we’ve doubled-down on our methodology to make sure the categories we share will truly reflect cohorts of peers.
But, here’s where your help is needed- the strength of the data set depends upon our participation!
In acknowledgement of your effort, we’re entering all who complete it before the 4/13 deadline into a drawing to win a Boot Camp ticket (…and did we mention Seth Godin is going to be there?). And, if you complete it by 4/11, we’ll enter you twice!
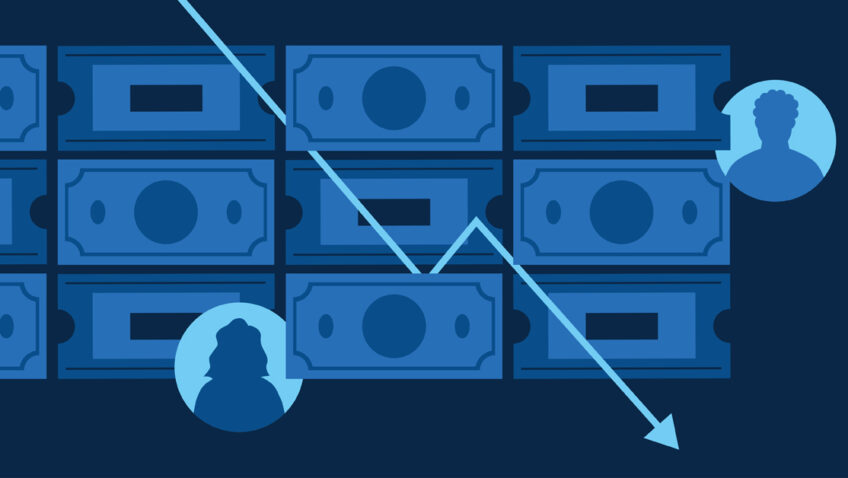
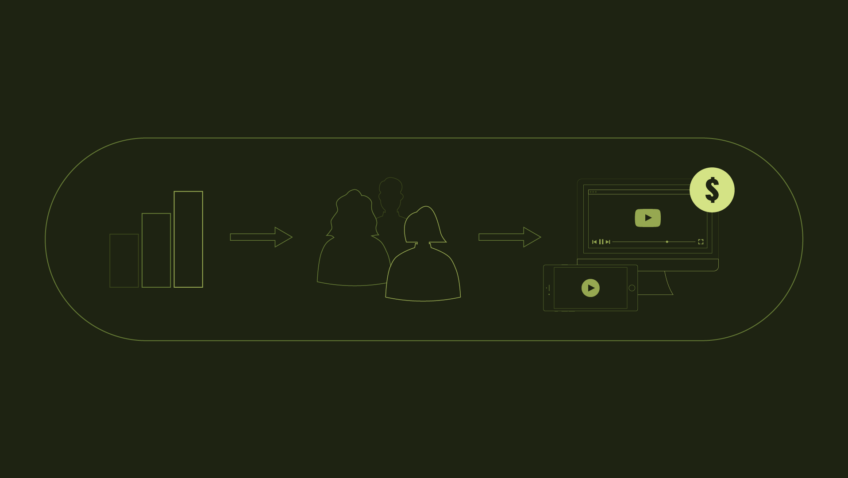
5. Data to make good decisions: compare to peers, understand where resources are going across the field, understand where common challenges lie
Just like we tell clients every day, data should inform your decisions. That’s just what this Benchmark can do- give you actionable intel on what’s happening in the field and a framework to assess how to navigate key areas of digital marketing.
Ready to make this the richest data set yet? Dive in now!